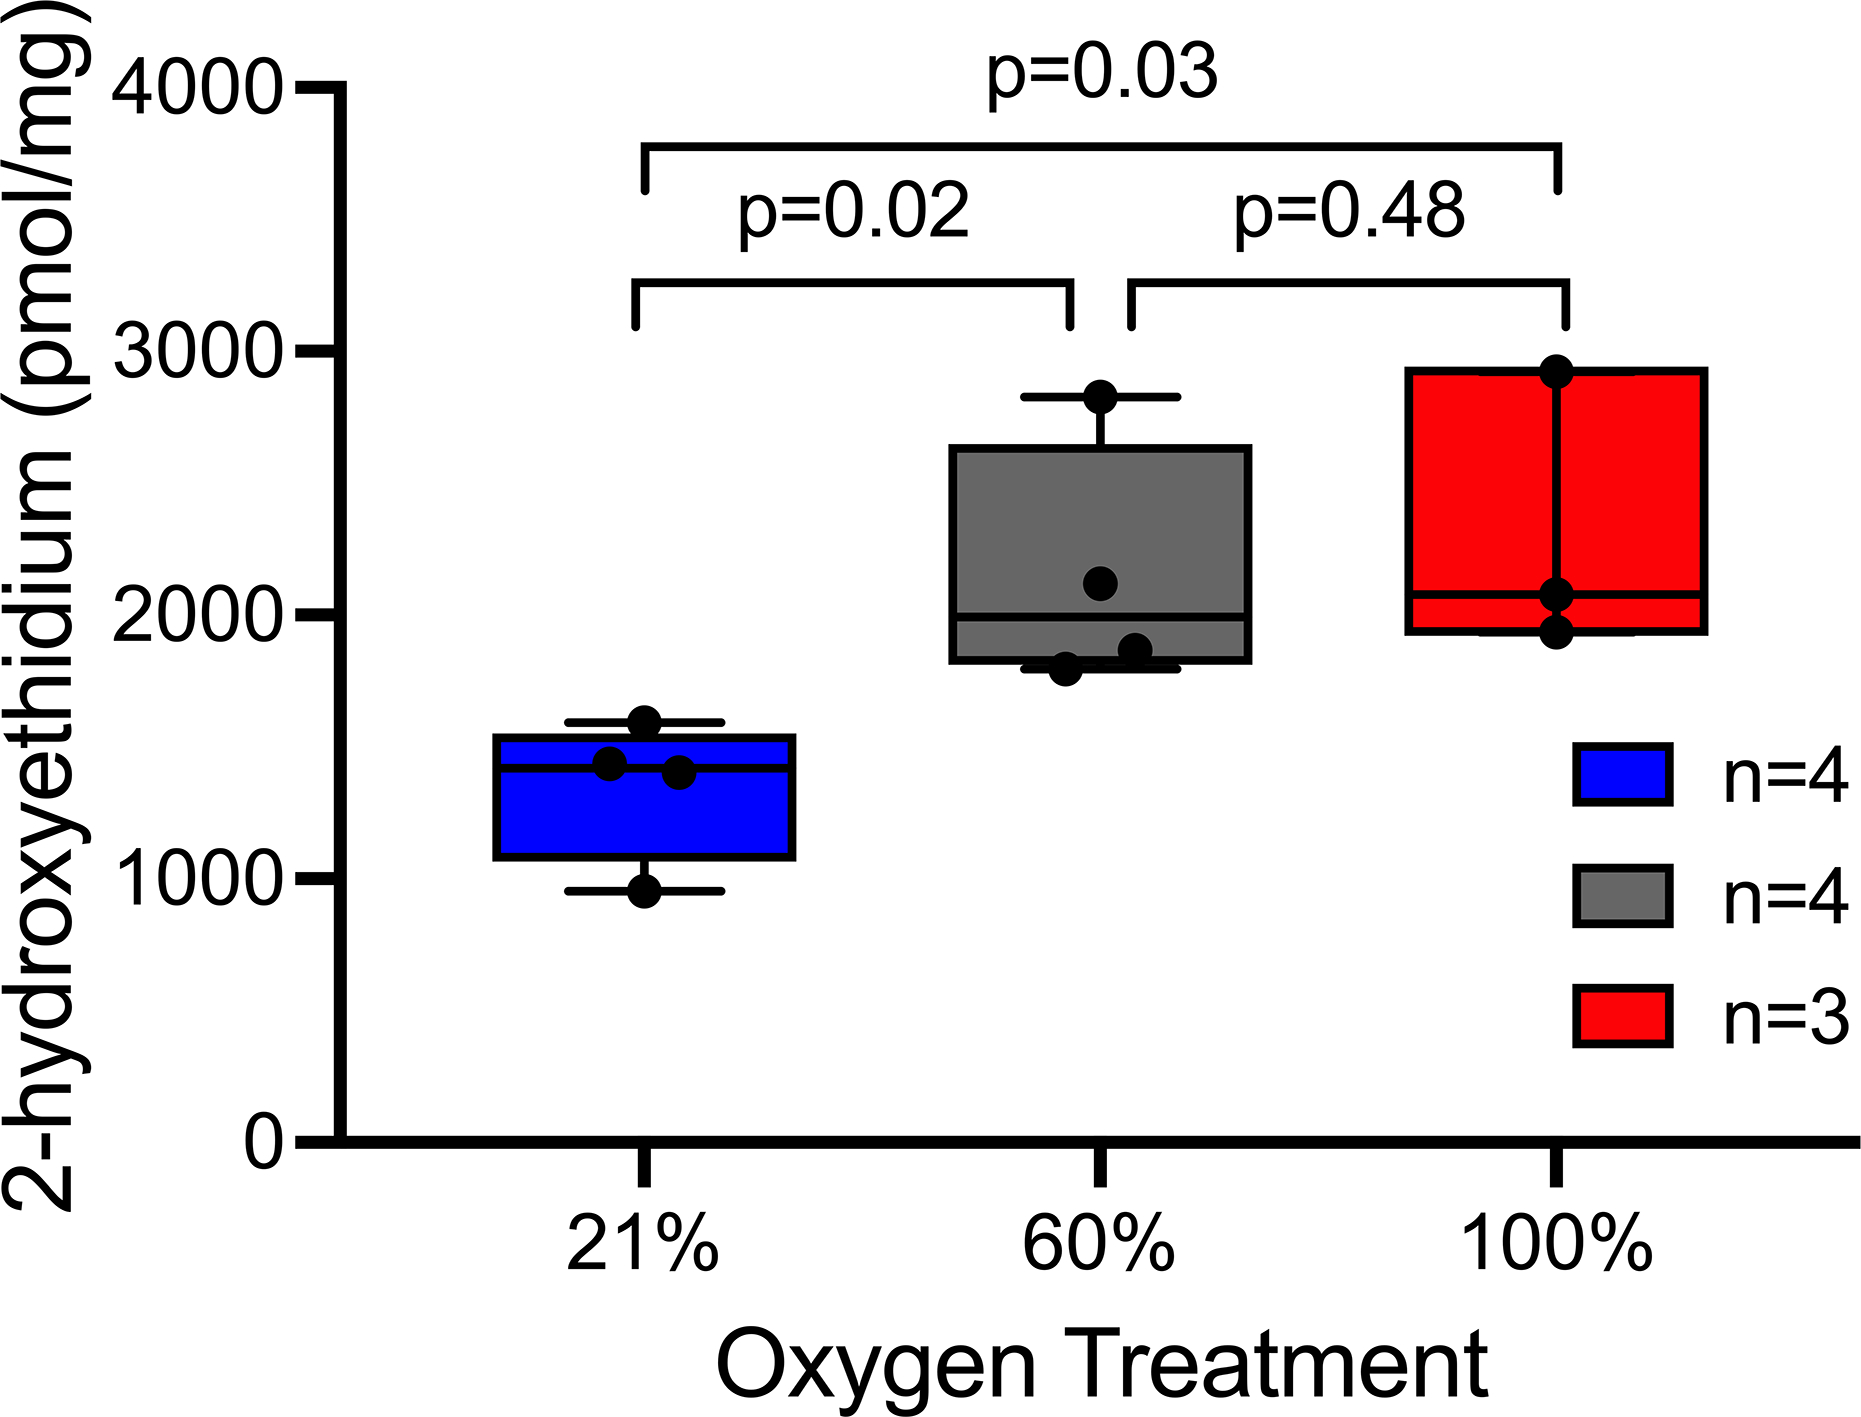
Figure 4.

Effect of oxygen treatment on aortic 2-hydroxyethidium production, presented as median ± SD per mg protein. Box and whisker plots represent the median, 25th and 75th percentiles in the box, and the minimum and maximum as whiskers. N represents number of mice in each group. p=0.008 for the effect of oxygen treatment across groups using the Jonckheere trend test. Comparisons between individual oxygen treatment groups used the Wilcoxon rank-sum test.
