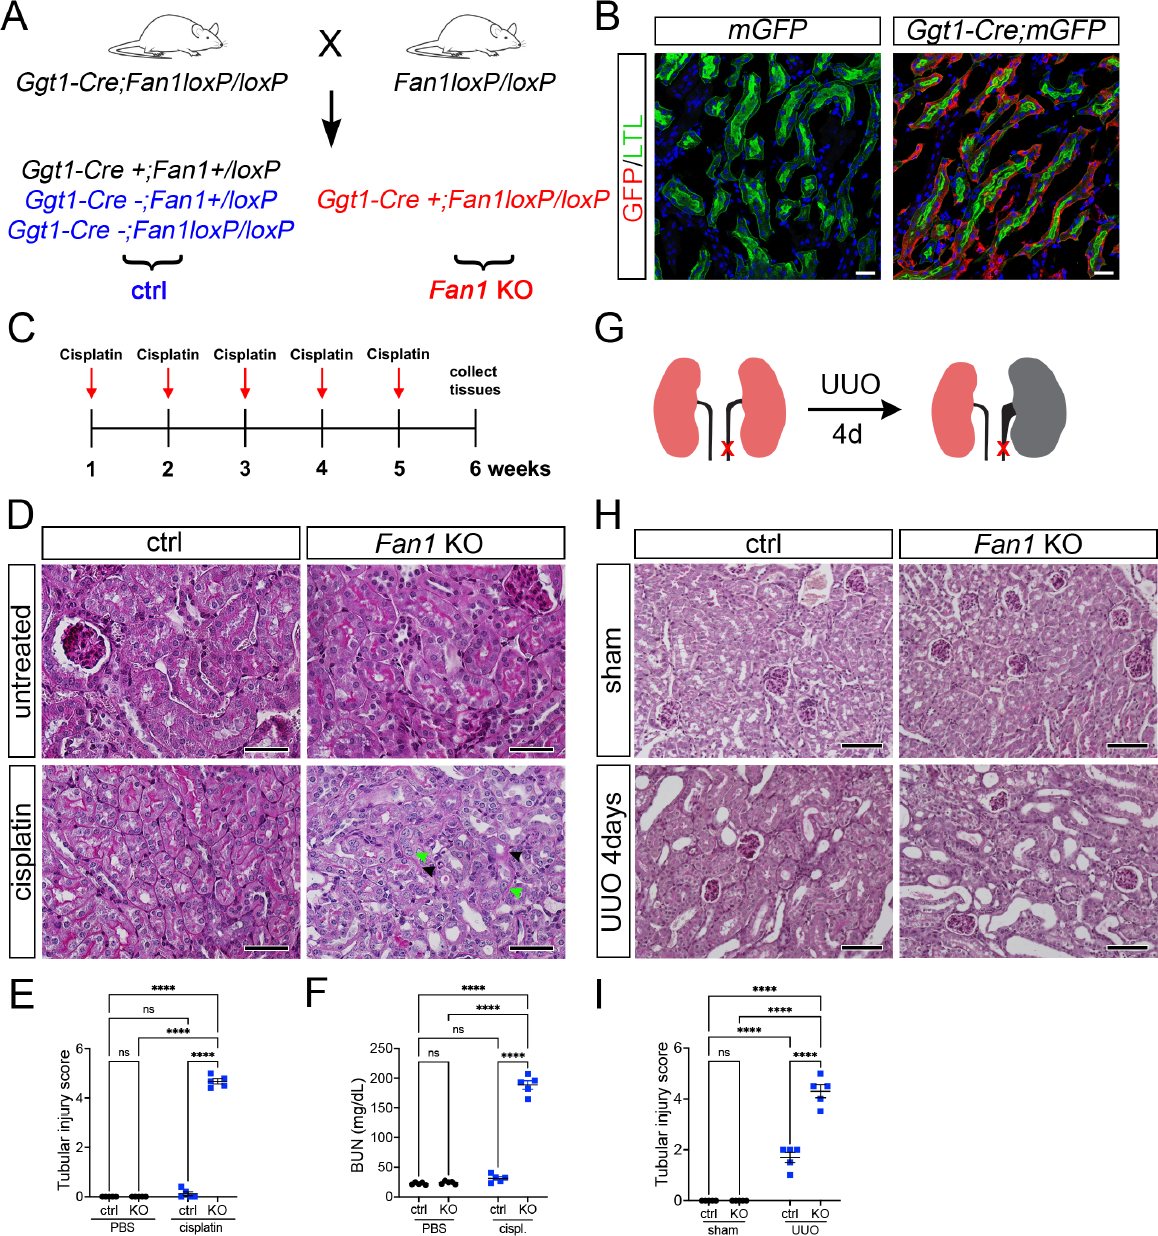
Figure 1. Loss of Fan1 sensitizes kidneys to genotoxic and obstructive tubular injury.

(A) Schematics of the generation of proximal tubule-specific Fan1 knockout (Fan1 KO) mice, by crossing Ggt1Cre;Fan1+/loxP mice with Fan1loxP/loxP mice.
(B) Ggt1-Cre activity is restricted to the proximal segment of the nephron, demonstrated by the co-staining of Lotus tetranogolobus agglutinin (LTL) and anti-GFP antibody in double transgenic mice but not in Ggt1Cre- mice. Scale bar 25 μm.
(C) Schematic diagram of the repeated low dose cisplatin injury protocol. Mice were administered cisplatin weekly at 2mg/kg for 5 weeks, and tissues were collected for analysis 1 week after the last treatment dose.
(D) Histological analysis of kidney sections by Periodic acid–Schiff (PAS) staining demonstrated the formation of KIN in Fan1 KO mice, characterized by tubular atrophy, formation of karyomegalic nuclei (green arrowheads) and segmental basement membrane thickening (black arrowheads) in the proximal tubules. Scale bars 50 μm.
(E) Tubular injury scores in control mice compared with Fan1 KO kidneys after low dose cisplatin administration, cisplatin ctrl 0.1±0.1 vs cisplatin Fan1 KO 4.7±0.1, ****p<0.0001, n=5 each.
(F) Blood urea nitrogen (BUN) measurements in ctrl and Fan1 KO mice show loss of kidney function in Fan1 KO mice after induction of KIN; cisplatin ctrl 31.2±2.9 vs cisplatin Fan1 KO 188.6±7.2, ****p<0.0001, n=5 each.
(G) Schematics of the unilateral ureteral obstruction (UUO) kidney injury model.
(H) PAS staining of sham and UUO kidneys at day 4 reveals more extensive tubular dilations in Fan1 KO kidneys compared with control kidneys. Scale bar 100 μm.
(I) Tubular injury scores in control mice compared to Fan1 KO kidneys after 4 days of UUO, ctrl 1.6±0.2 vs Fan1 KO 4.2±0.1, ****p<0.0001, n=5 each. (E,F,I) Data are presented as the mean ± SEM. A 2-way ANOVA with Tukeys’ post hoc analysis.
