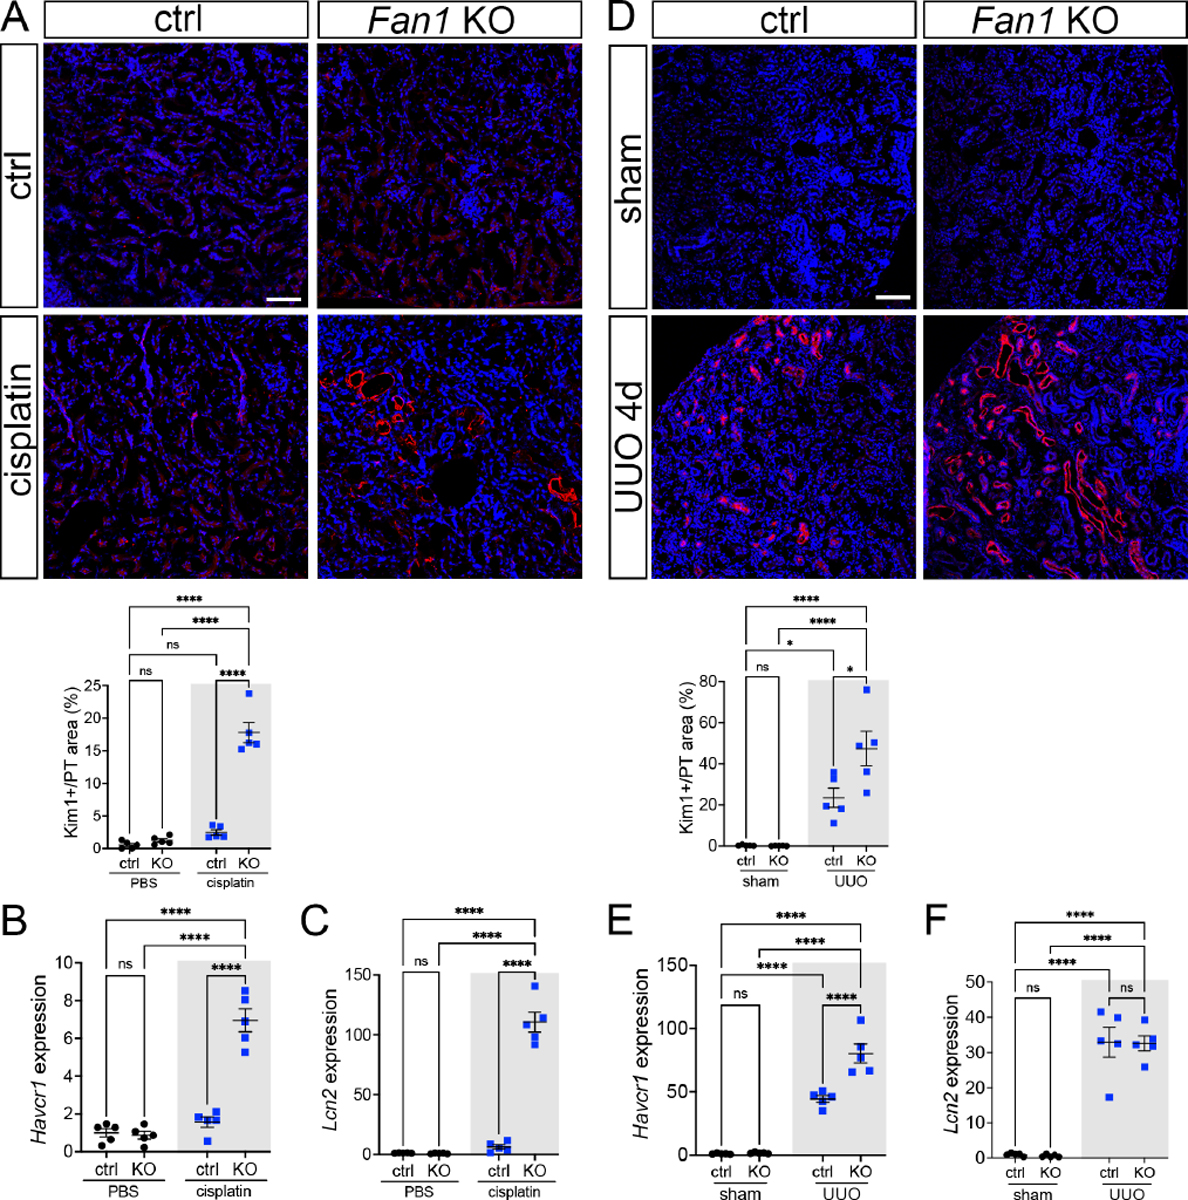
Figure 2. Persistent DNA damage induces the expression of tubular injury biomarkers in Fan1 KO kidneys.

(A) KIM1 expression analysis by immunofluorescence staining in control and Fan1 KO kidneys after cisplatin injury. Scale bar 75 μm. Quantification of the KIM1-positive area in LTL-positive proximal tubules shows a significant upregulation of KIM1 in Fan1 KO kidneys (ctrl 2.5±0.4% vs Fan1 KO 17.8±1.6%, ****p<0.0001), n=5 each.
(B) Increased Havcr1/KIM1 expression in cisplatin treated Fan1 KO kidneys was confirmed by qPCR analysis (ctrl 1.6±0.3 vs Fan1KO 6.9±0.6, ****p<0.0001), n=5 each.
(C) qPCR analysis revealed increased Lcn2/NGAL expression in cisplatin treated Fan1 KO kidneys (ctrl 6.1±1.8 vs Fan1 KO 110.7±8.4, ****p<0.0001), n=5 each.
(D) KIM1 expression analysis by immunofluorescence staining in control and Fan1 KO kidneys 4 days after unilateral ureteral obstruction (UUO). Scale bar 100 μm. Quantification of the KIM1-positive area in LTL-positive proximal tubules shows higher KIM1 expression in Fan1 KO UUO kidneys (ctrl 23.5% ± 4.7% vs Fan1 KO 47.4% ± 8.4% %, *p<0.05, ****p<0.0001), n=5 each.
(E) Increased Havcr1/KIM1 expression in Fan1 KO UUO kidneys compared to control UUO kidneys was confirmed by qPCR (ctrl 44.3±2.7 vs Fan1 KO 80.3±7.5, ****p<0.0001), n=5 each.
(F) qPCR analysis did not reveal significant alterations in Lcn2/Ngal expression between Fan1 KO and control kidneys after 4 days of UUO (ctrl 32.9±4.3 vs Fan1 KO 32.6±2.1, ns), n=5 each. (A-F) Data are presented as the mean ± SEM. A 2-way ANOVA with Tukeys’ post hoc analysis.
