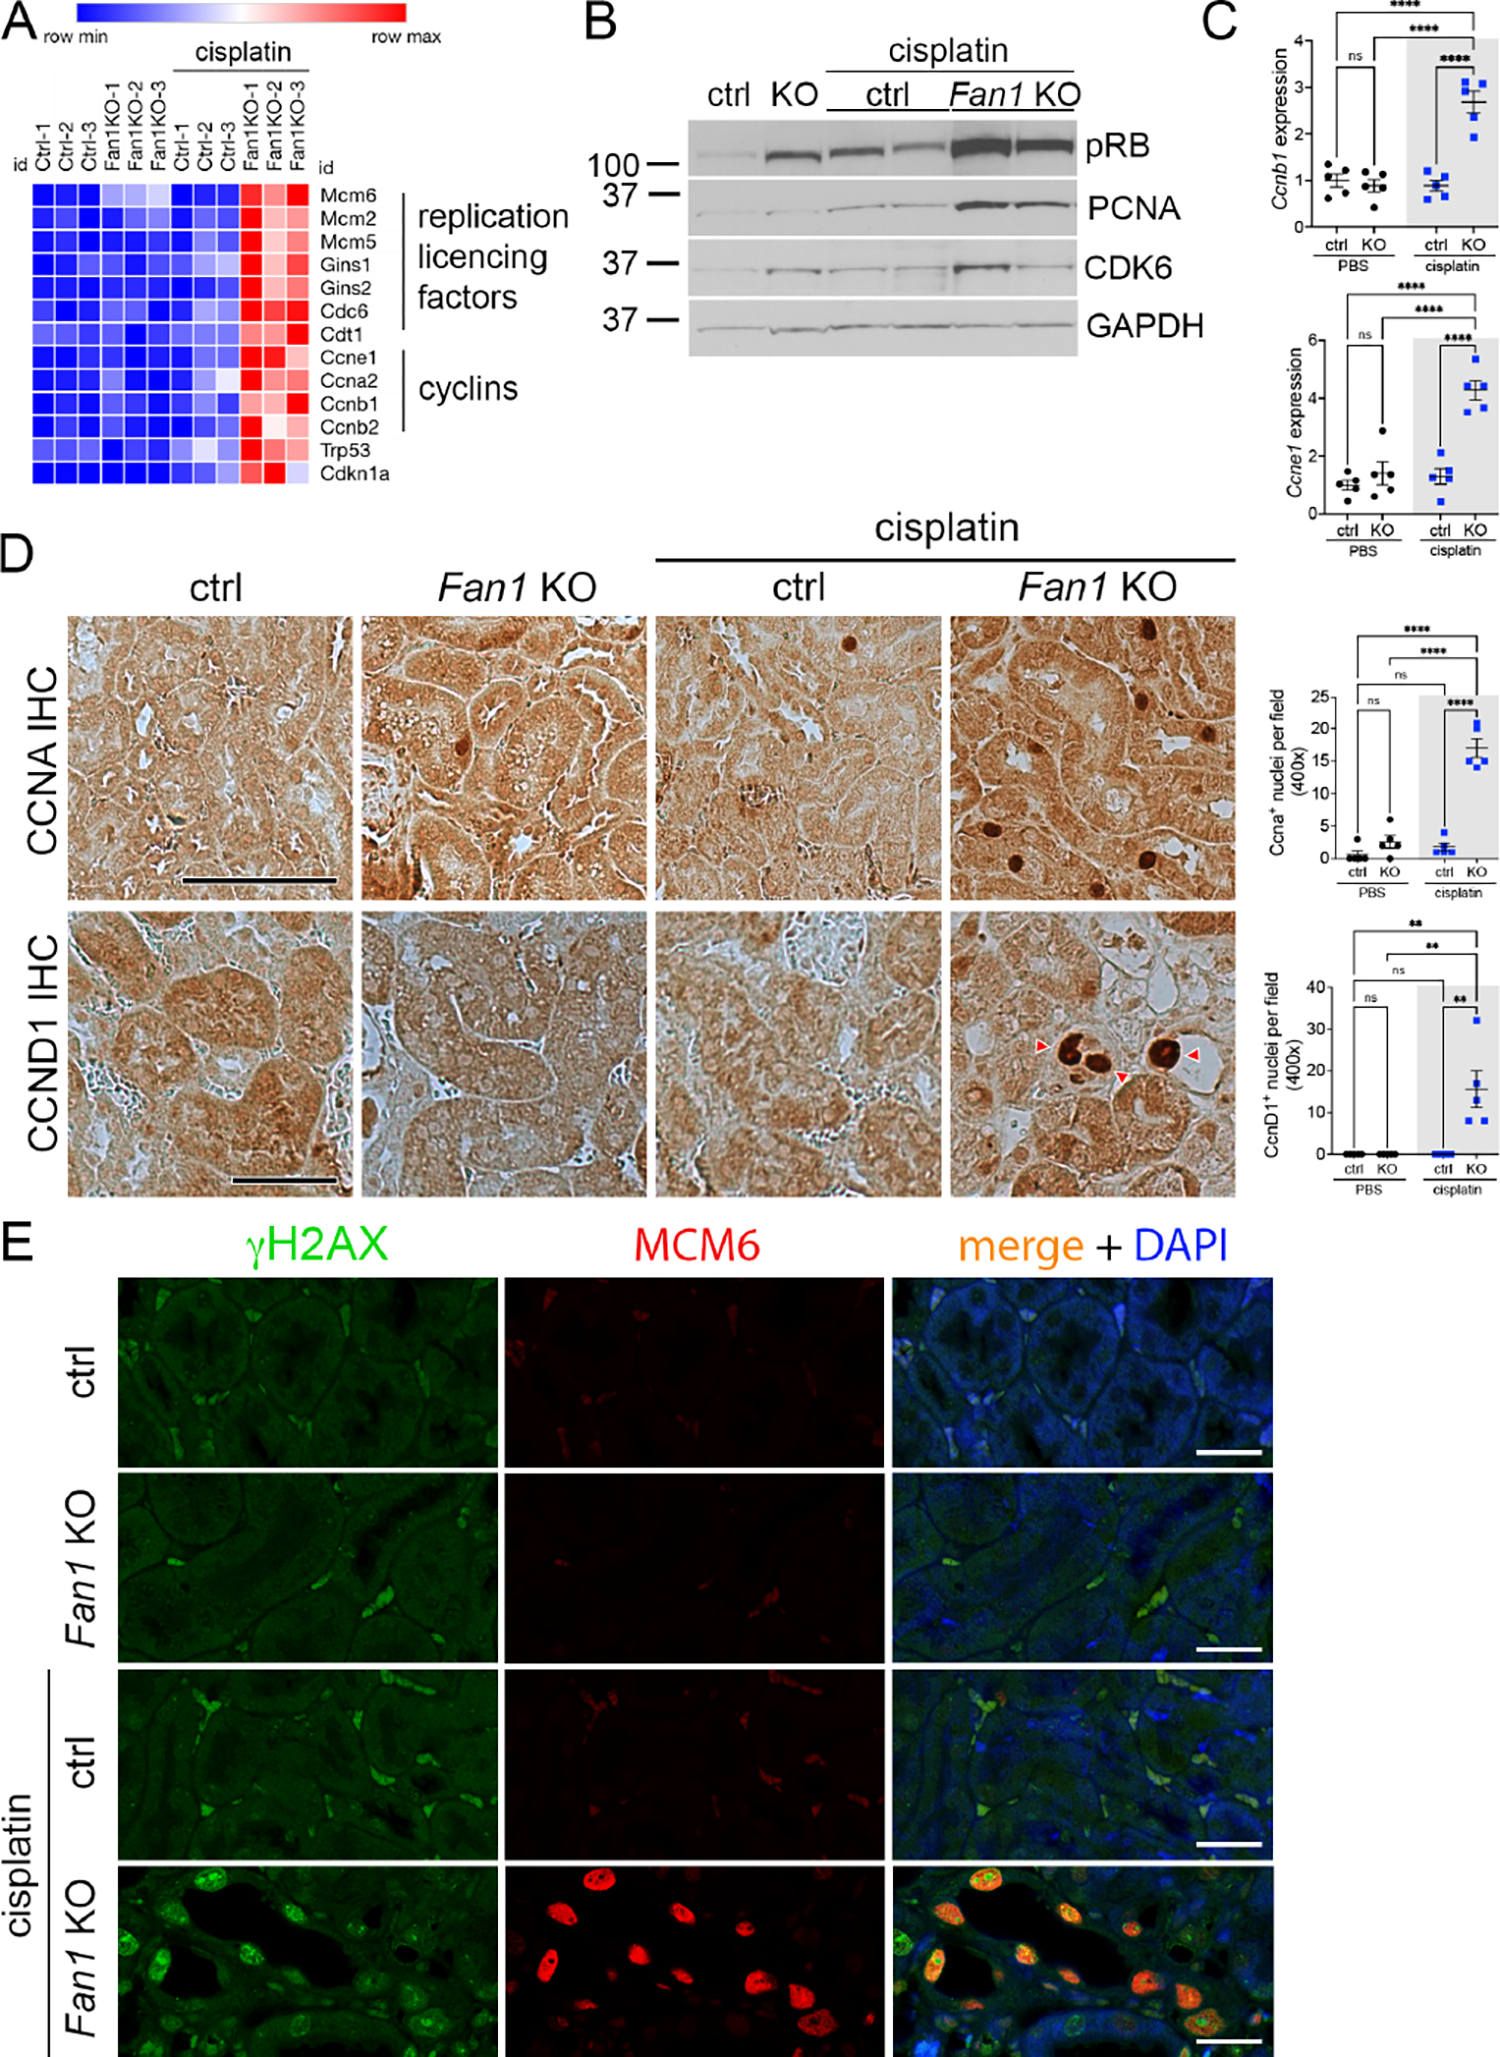
Figure 4. DNA damage causes aberrant cell cycle activity in Fan1 KO kidneys.

(A) Heatmap of a selection of key cell cycle regulating genes that were upregulated in the RNAseq analysis of Fan1 KO kidneys after cisplatin injury.
(B) Western blot of cell proliferation markers - pRB (S807/811), PCNA and CDK6, in untreated and cisplatin treated kidneys. Gapdh was used as a loading control.
(C) qPCR validation of the increased expression of Ccne1 and Ccnb1 in cisplatin Fan1 KO kidneys. Ccne1 (ctrl 1.3±0.4 vs Fan1 KO 5.2±0.8, ****p<0.0001), Ccnb1 (ctrl 0.7±0.1 vs Fan1 KO 2.6±0.4, ****p<0.0001), n=5 each.
(D) Immunohistochemistry against CCNA and CCND1. The number of CCNA+ cells is increased in cisplatin Fan1 KO kidneys compared with controls. Quantification of CCNA+ nuclei in in 6 random cortical fields (cisplatin ctrl 2.2±0.9 vs cisplatin Fan1 KO 16.0±0.9, ****p<0.0001, n=5 each cohort). Nuclear accumulation of Cyclin D1 (red arrowheads) was observed only in cisplatin treated Fan1 KO kidneys. Quantification of CCND1+ nuclei in 6 random cortical fields (cisplatin treated ctrl 0.0±0.0 vs cisplatin Fan1 KO 14.0±2.6, n=5 each cohort, **p<0.01). Scale bar 50 μm.
(E) Immunofluorescent (IF) analysis of the DNA damage marker γH2AX (green) and minichromosome maintenance protein 6, MCM6 (red) revealed their co-expression in the giant nuclei in cisplatin treated Fan1 KO kidneys, but not in control kidneys. Scale bar 25 μm.
(C,D) Data are presented as the mean ± SEM. A 2-way ANOVA with Tukeys’ post hoc analysis.
