
Figure 1. ILC has a unique chromatin cell state.
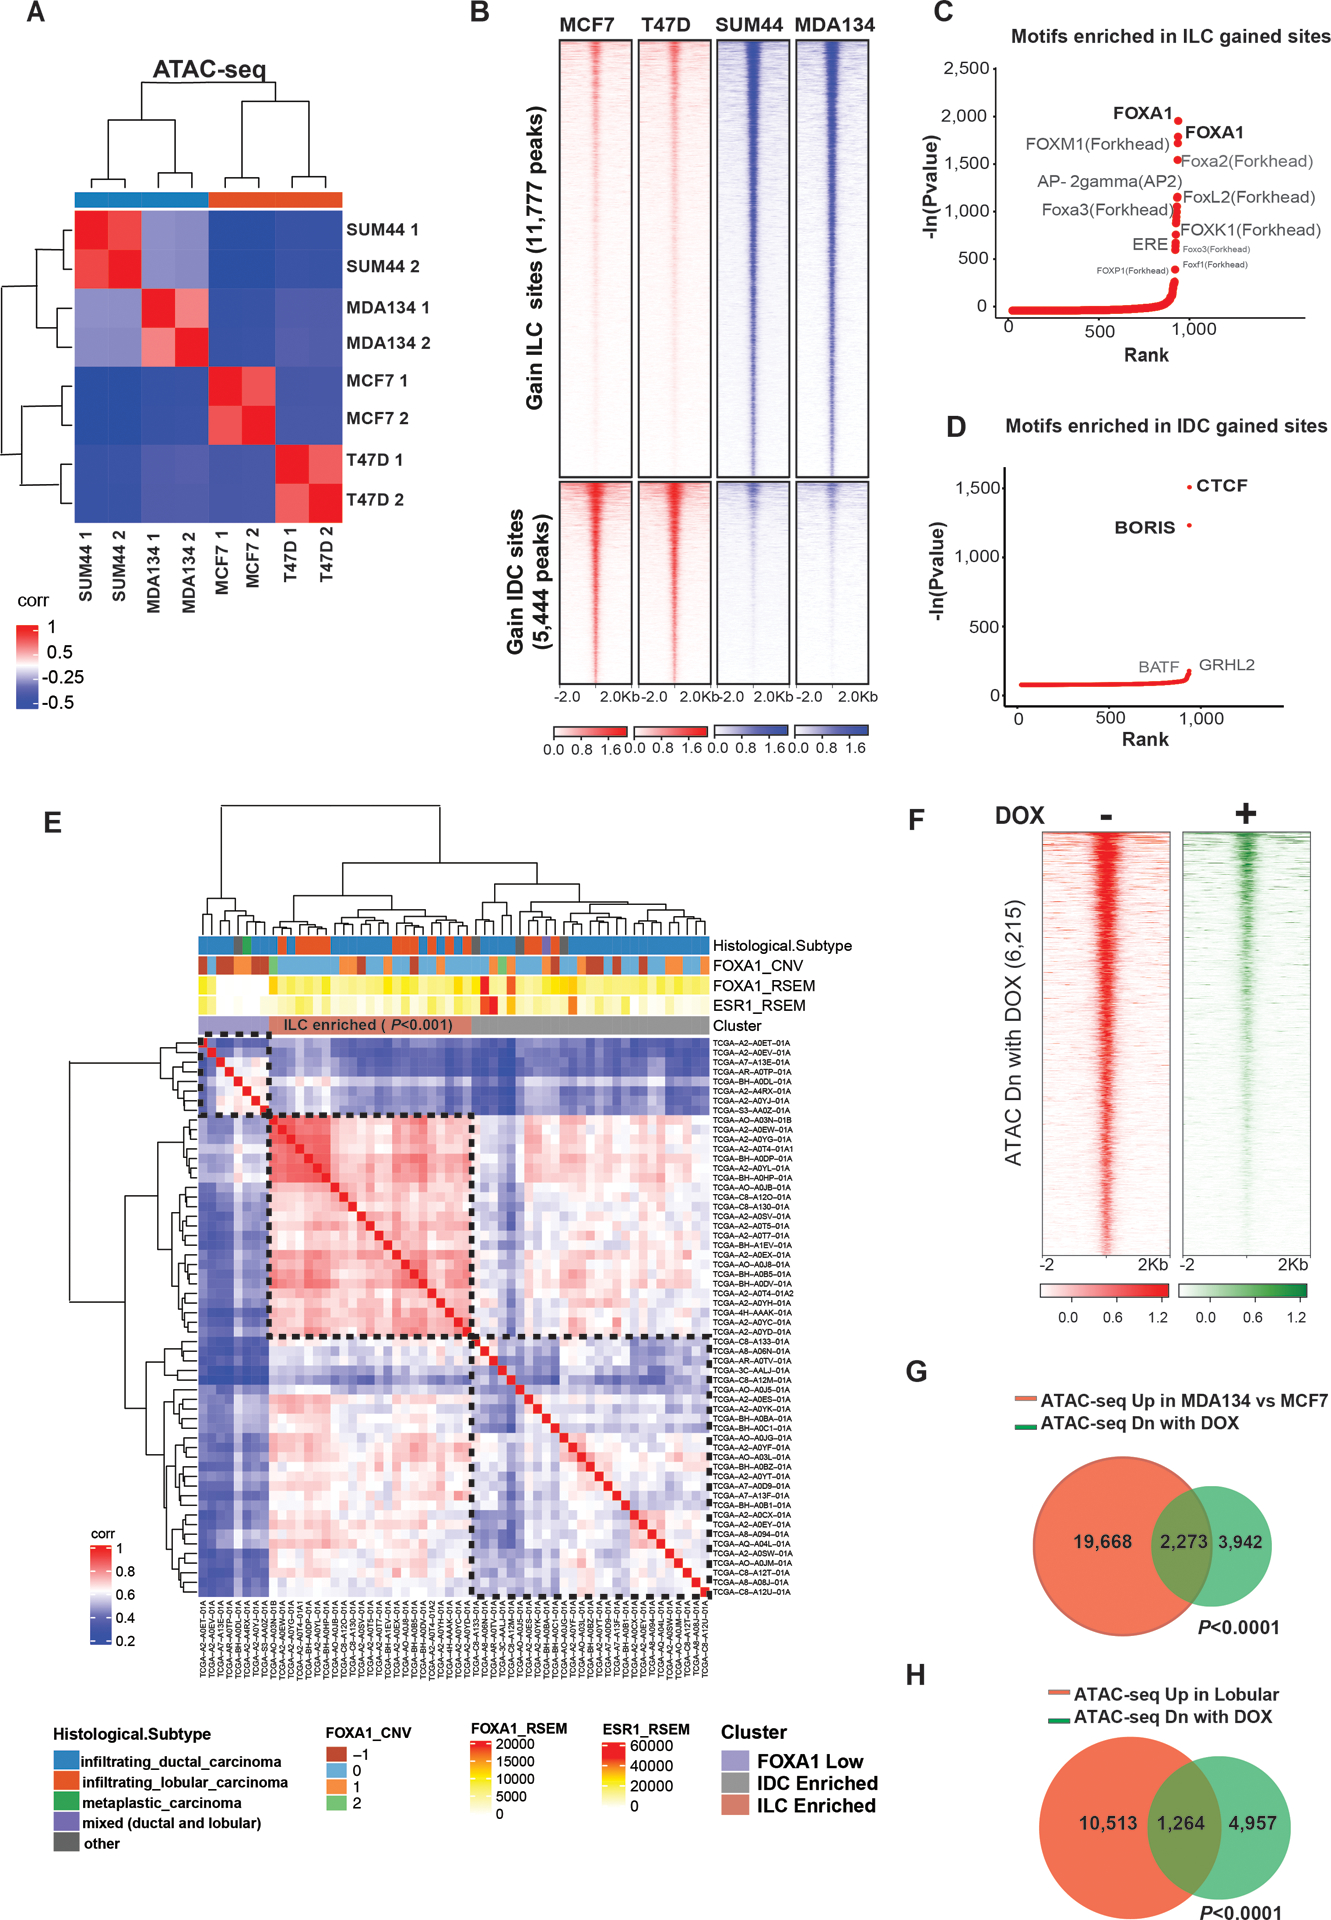
(A) Sample to sample correlation of chromatin accessibility based on transposase-accessible chromatin followed by sequencing (ATAC-seq) by the Euclidean distance between rows/columns and Ward’s method of invasive lobular cancer (ILC) cells (MDAMB134 (MDA134) and SUM44) and invasive ductal cells (IDC) cells (MCF7 and T47D) cells after 10nM β-estradiol (E2) stimulation (cells were grown in hormone deprived (HD) conditions for 3 days followed by 45-minute treatment with 10nM E2). Shown in the plot are results of replicates. (B) Tornado plots of chromatin accessible sites gained in ILC cells (11,777 peaks) in blue and gained in the IDC cells (5,444 peaks) in red (Log 2FC >1 or <−1, Q<0.01). Chromatin accessible sites are shown in a horizontal window of ±2 kb from the peak center. (C-D) Ranking of motifs enriched in the ILC (C) and IDC (D) gained accessible sites based on p-value. (E) Sample to sample correlation heatmap of open chromatin sites in TCGA ER+ BC tumors applying only the chromatin accessible sites gained in the ILC cell line models (11,777 peaks). Samples are clustered by the Euclidean distance between rows/columns and Ward’s method. Samples cluster to three groups including an ILC enriched group (Fisher’s exact test). (F) Tornado plots of chromatin accessible sites lost when FOXA1 is downregulated by a doxycycline (DOX)-inducible shRNA after 3 days of DOX in presence of HD and 45min 10nM E2. (G-H) Venn diagrams of chromatin accessible sites upregulated in MDA134 in comparison to MCF7 (in red) (G) or upregulated in lobular cells in comparison to ductal cells (in red) (H) and the chromatin accessible sites lost by downregulation of FOXA1 by shRNA (in green).