
Figure 2. FOXA1 Reprogramming in ILC is linked to the ILC unique chromatin state.
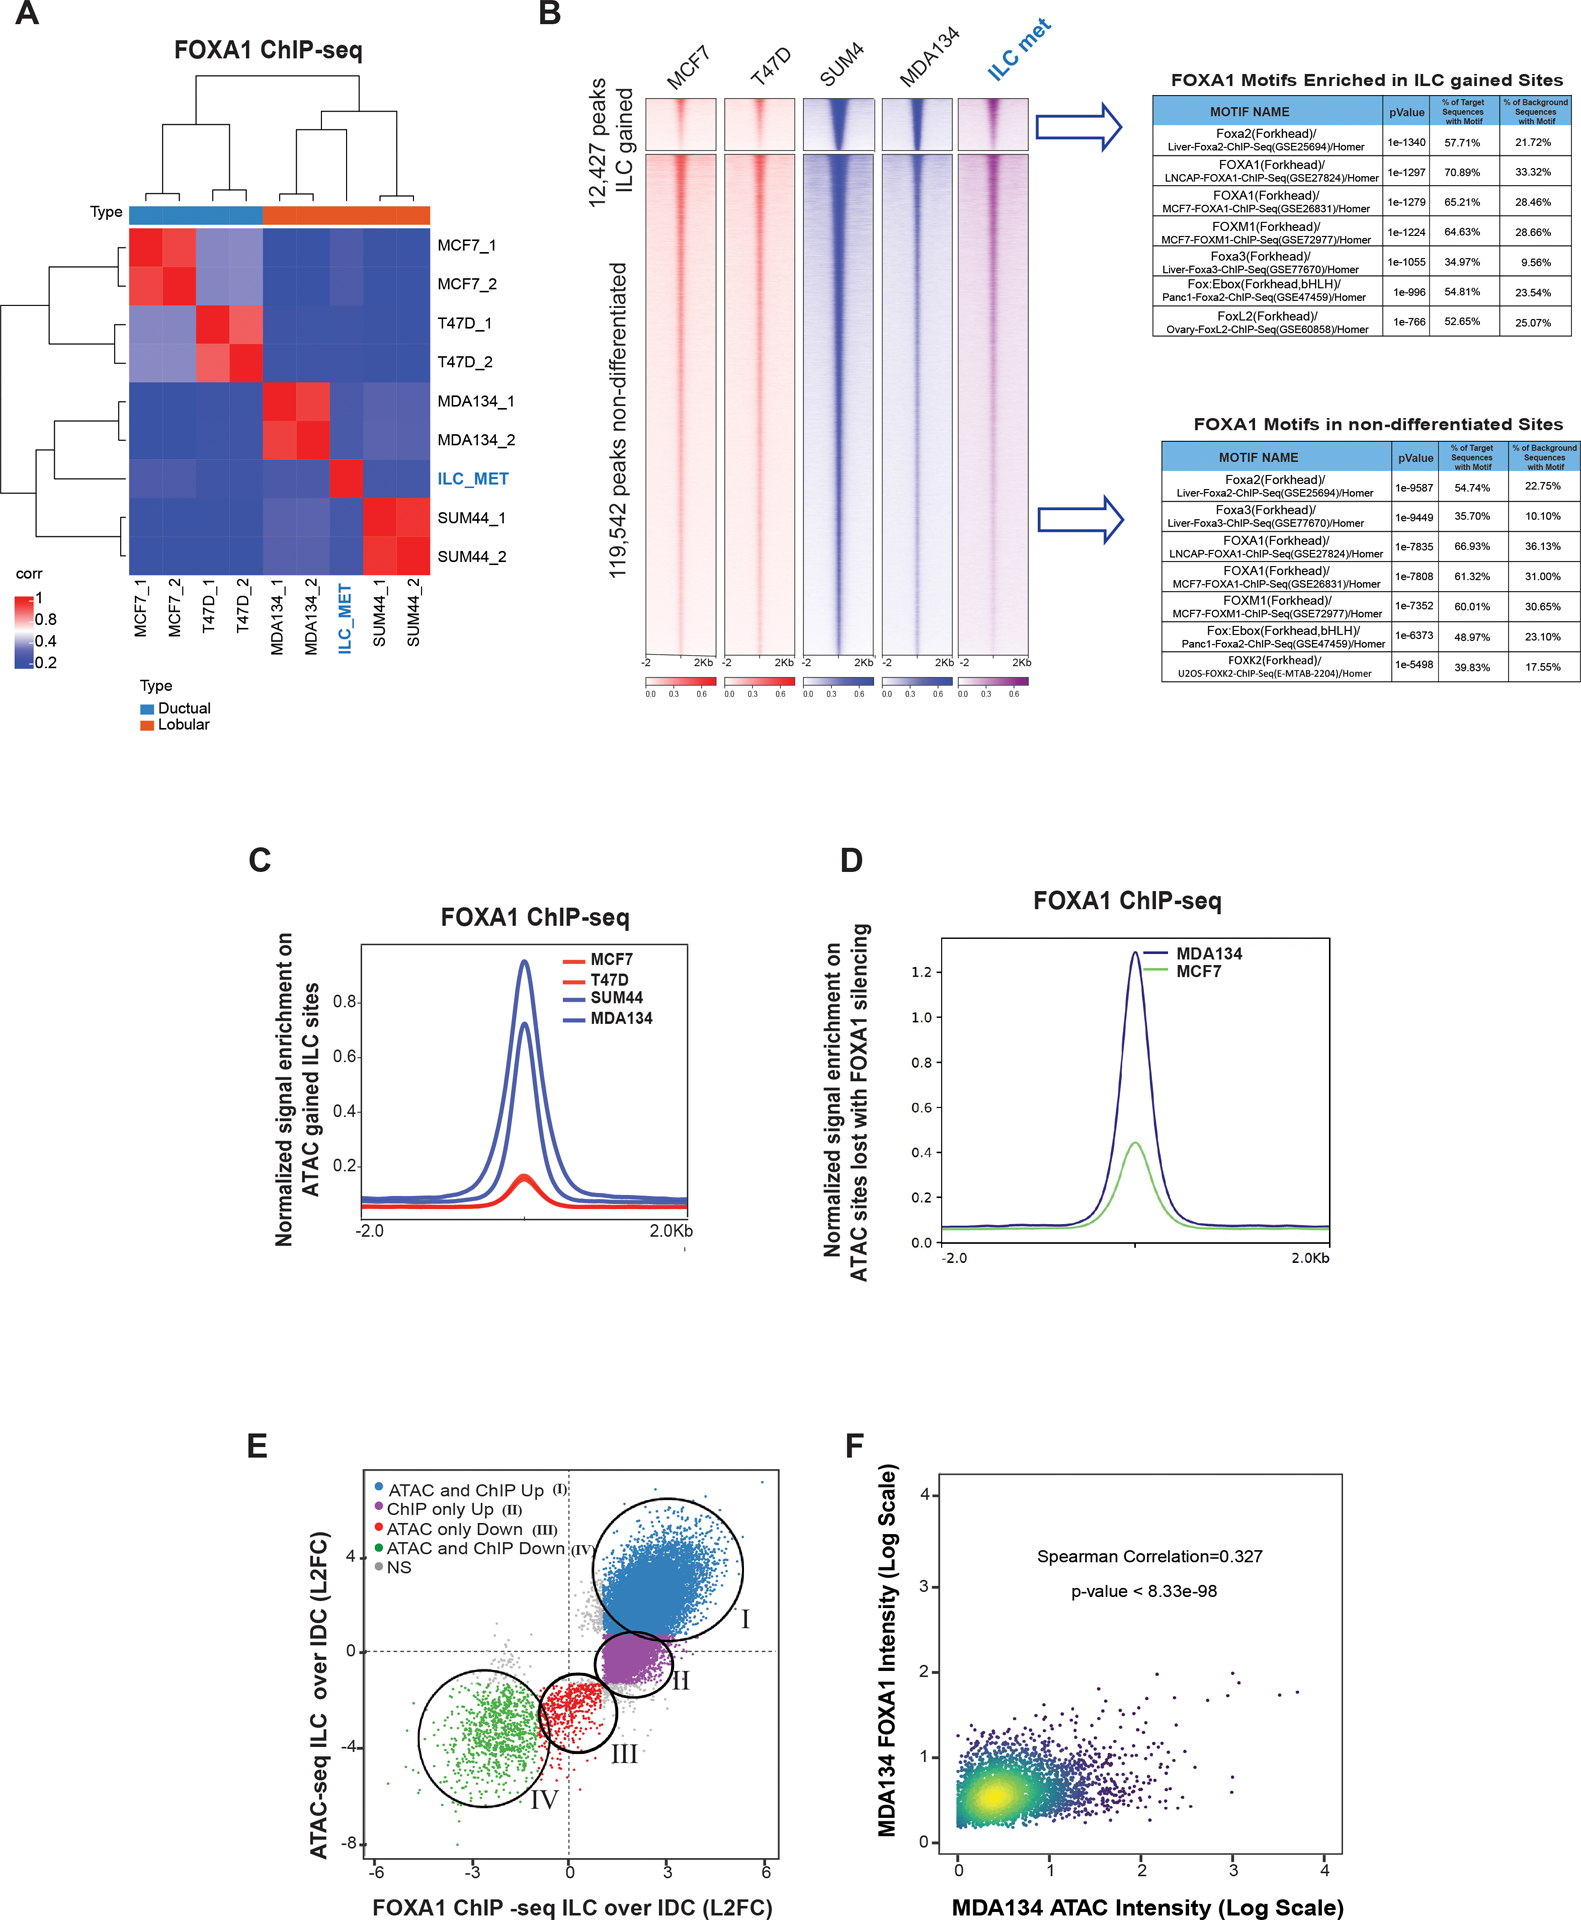
(A) Sample to sample correlation (Euclidean distance between rows/columns and Ward’s method) of FOXA1 binding sites correlation plots between all four cell lines in replicates (MCF7, T47D, MDA134 (MDAMB134) and SUM44) and the primary ILC cells isolated from a malignant peritoneal effusion from a patient with ER positive (ER+) metastatic ILC (ILC met). (B) Tornado plots of FOXA1 binding sites (12,427 sites) gained in ILC (MDA134 and SUM44) compared to IDC cells (MCF7 and T47D) and the union of the non-differentiated sites (Log 2FC >1 or <−1, Q<0.01). Table of the top motifs enriched in the FOXA1 binding sites gained in ILC versus IDC cells (Top) and FOXA1 binding sites non-differentiated between (Bottom) comparing the ILC and IDC sites are reported. (C) Quantitative normalized signal of FOXA1 binding based on FOXA1 ChIP-seq in the ILC gained chromatin gained accessible sites based on the ATAC-seq analysis. (D) Quantitative normalized signal of FOXA1 binding based on FOXA1 ChIP-seq in the chromatin accessible sites lost in MDA134 after FOXA1 silencing based on the ATAC-seq analysis. (E) Comparison of log2FC between ILC (MDA134 and SUM44) and IDC (MCF7 and T47D), FOXA1 binding sites (FOXA1 ChIP-seq, x-axis) versus the log2FC comparing chromatin accessibility (ATAC-seq, y-axis) between ILC (MDA134 and SUM44) and IDC (MCF7 and T47D). (F) Intensity of binding in the intersecting sites of ILC gained FOXA1 binding and ATAC-seq in MDA134 versus MCF7 cells. Spearman correlation and p-value are reported.