
Figure 4. FOXA1 drives the ILC unique transcriptome.
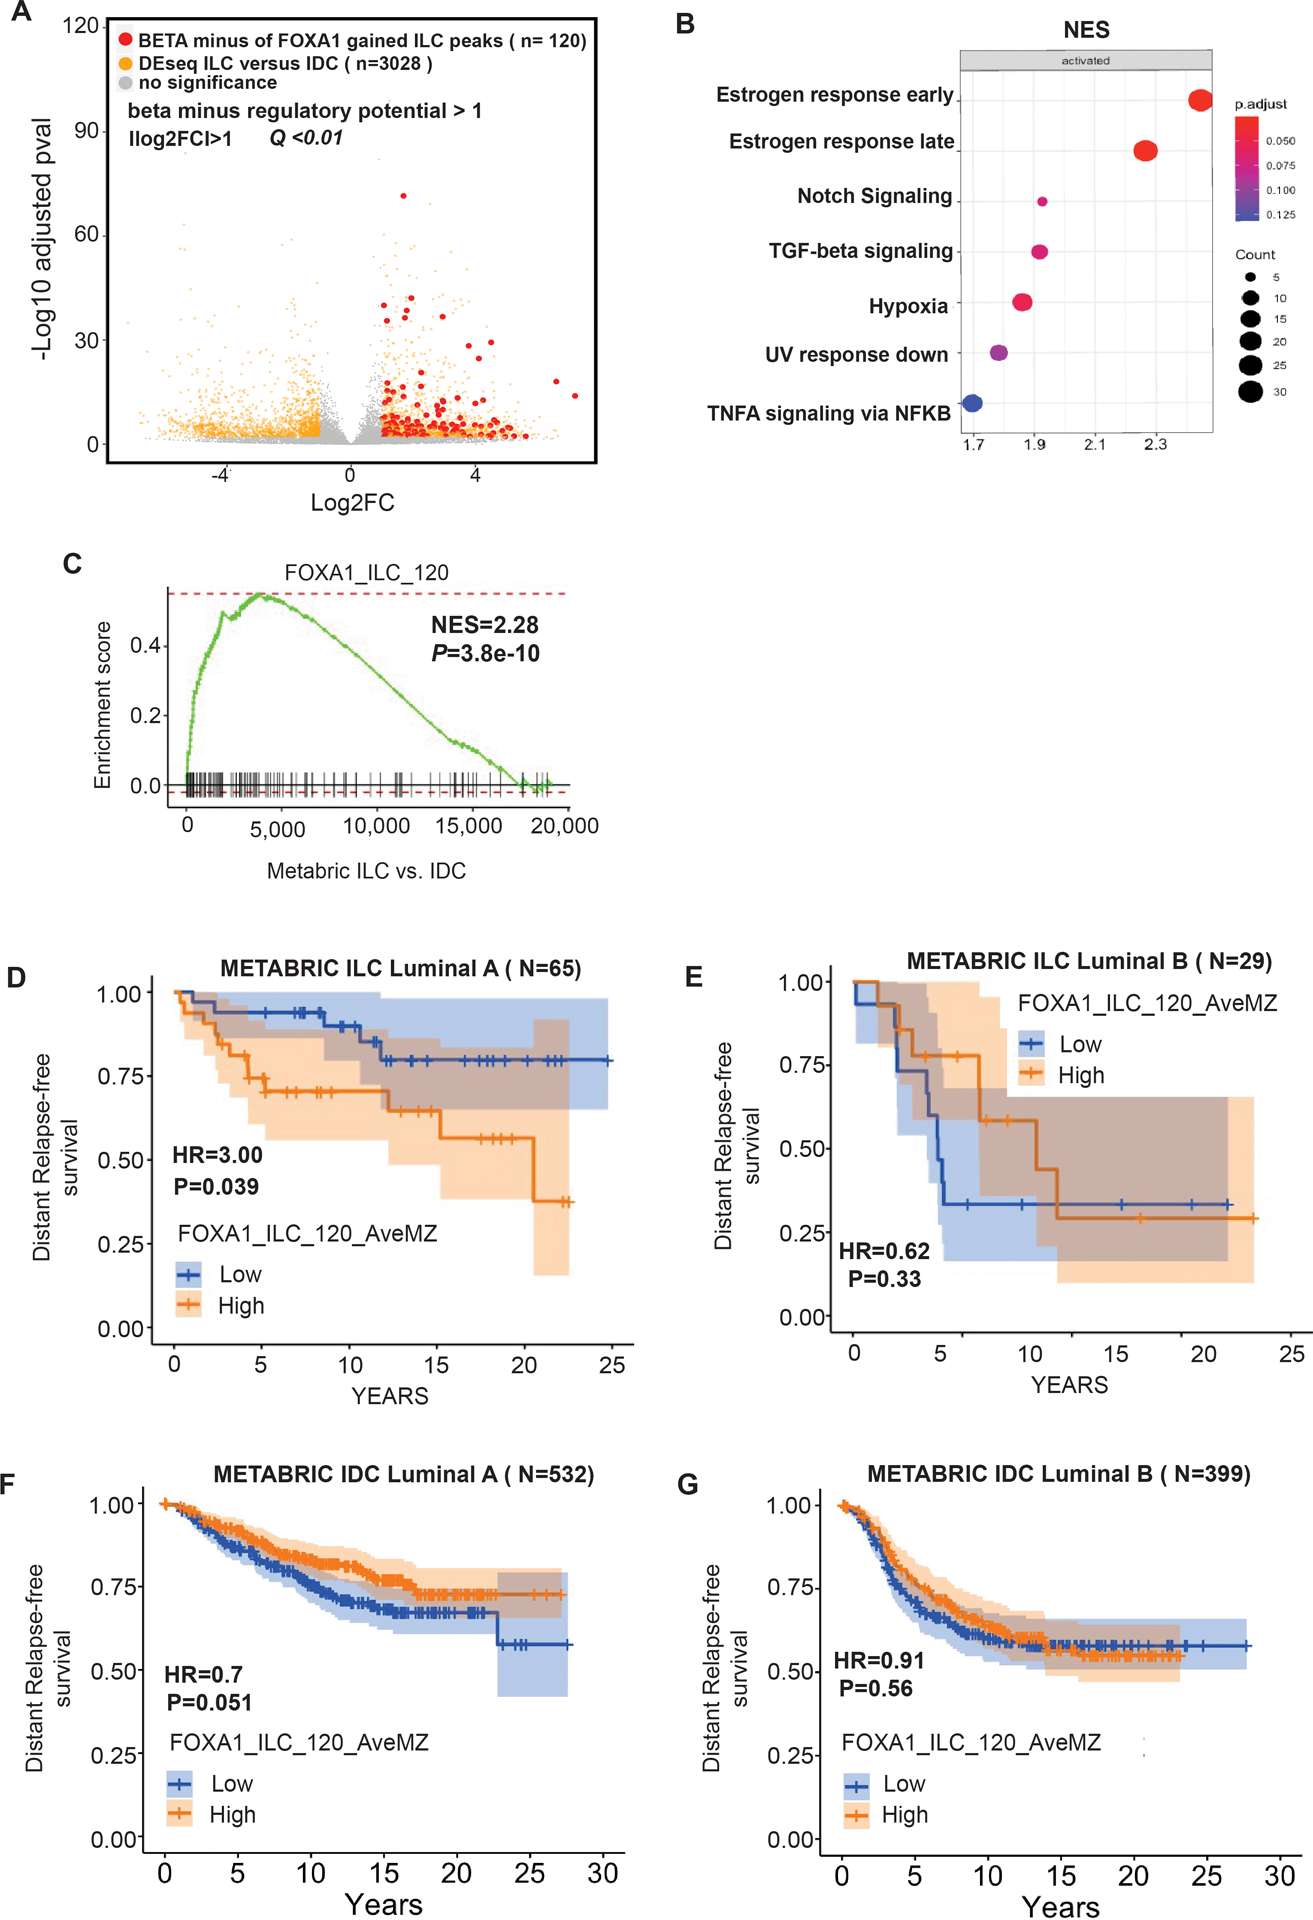
(A) Volcano plot depicting differential (DEseq2) expression comparing RNA-seq of ILC cells (MDA134 and SUM44) versus IDC cells (MCF7 and T47D) after β-estradiol stimulation (E2). Shown in yellow are the genes with significant differential expression ([log2FC] >1, Q<0.01. DESeq2). Red dots represent the genes with significant differential expression ([log2FC] >1, Q<0.01. DESeq2) and are regulated by FOXA1 ILC gained binding sites based on Binding and Expression Target (BETA) minus analysis. (B) Hallmark pathways enriched in the genes regulated by the ILC gained FOXA1 sites based on BETA basic. The normalized enrichment score (NES) is represented in the X-axis, the number of genes in the dataset is the count number represented by the circle size, q-value <0.25. (C) Enrichment plot from Gene Set Enrichment Analysis (GSEA) showing enrichment of the FOXA1_ILC_120 gene set derived from the ILC gained binding sites in ILC versus IDC estrogen receptor positive breast cancers in the METABRIC cohort. (D) Distant free survival in patients with Luminal A molecular subtype ILC from the METABRIC cohort comparing patients with high versus low expression of the FOXA1_ILC_120 gene set. (E) Distant free survival in patients with Luminal B molecular subtype type ILC from the METABRIC cohort comparing patients with high versus low expression of the FOXA1_ILC_120 gene set. (F) Distant free survival in patients with Luminal A molecular subtype IDC from the METABRIC cohort comparing patients with high versus low expression of the FOXA1_ILC_120 gene set. (G) Distant free survival in patients with Luminal B molecular subtype IDC from the METABRIC cohort comparing patients with high versus low expression of the FOXA1_ILC_120 gene set.