
Figure 7. Cellular potency versus selectivity plot of selected best HDAC10 inhibitors.
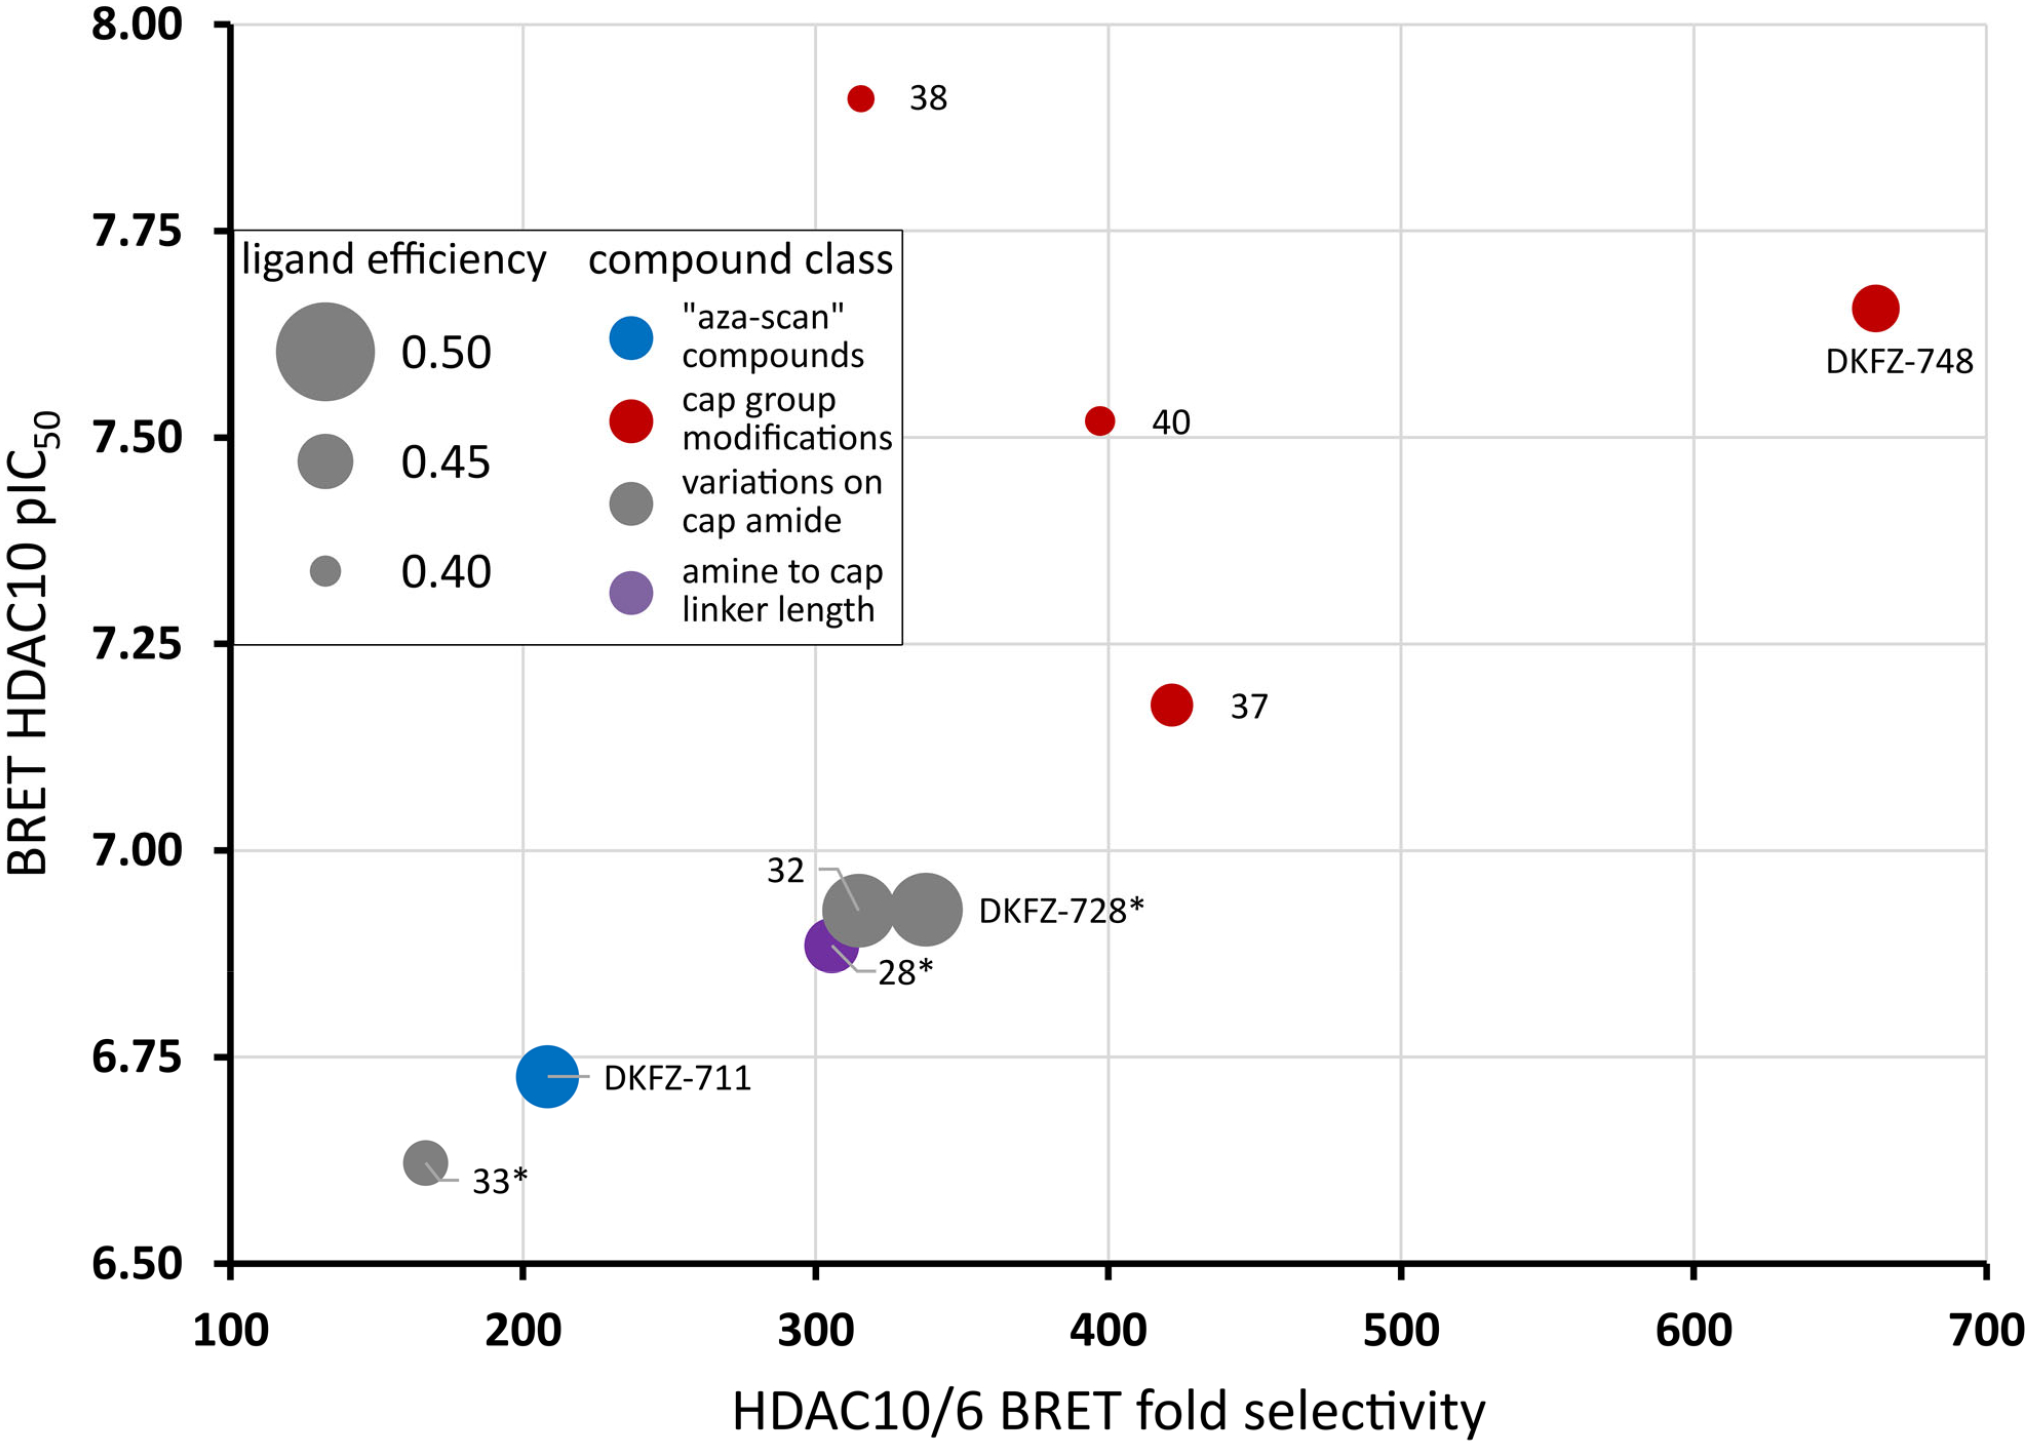
DKFZ-748 achieves the best cellular target engagement and HDAC10 selectivity. Dot size represents ligand efficiency (LE = 1.37 × pIC50(HDAC10) / number of heavy atoms) (38). Colors represent from which “box” from Table 1 and Figures 2 and 3 the compounds originate: Blue dots: “aza-scan” compounds (Figure 2); Red dots: cap modifications based on DKFZ-728 (Figure 3); Grey dots: cap attachment amide modifications (Table 1); Purple dots: amine to cap amide linker length variations of DKFZ-728 scaffold (Table 1). *: HDAC6 pIC50 could not be accurately determined due to lack of activity. Selectivity was calculated using the HDAC6 assay limit (pIC50 of 4.4), actual selectivity may be higher. For a tabulated and extended version of this plot with 95% confidence intervals, see Table S3.