
Figure 8. Cellular drug-effect markers and cytotoxicity data.
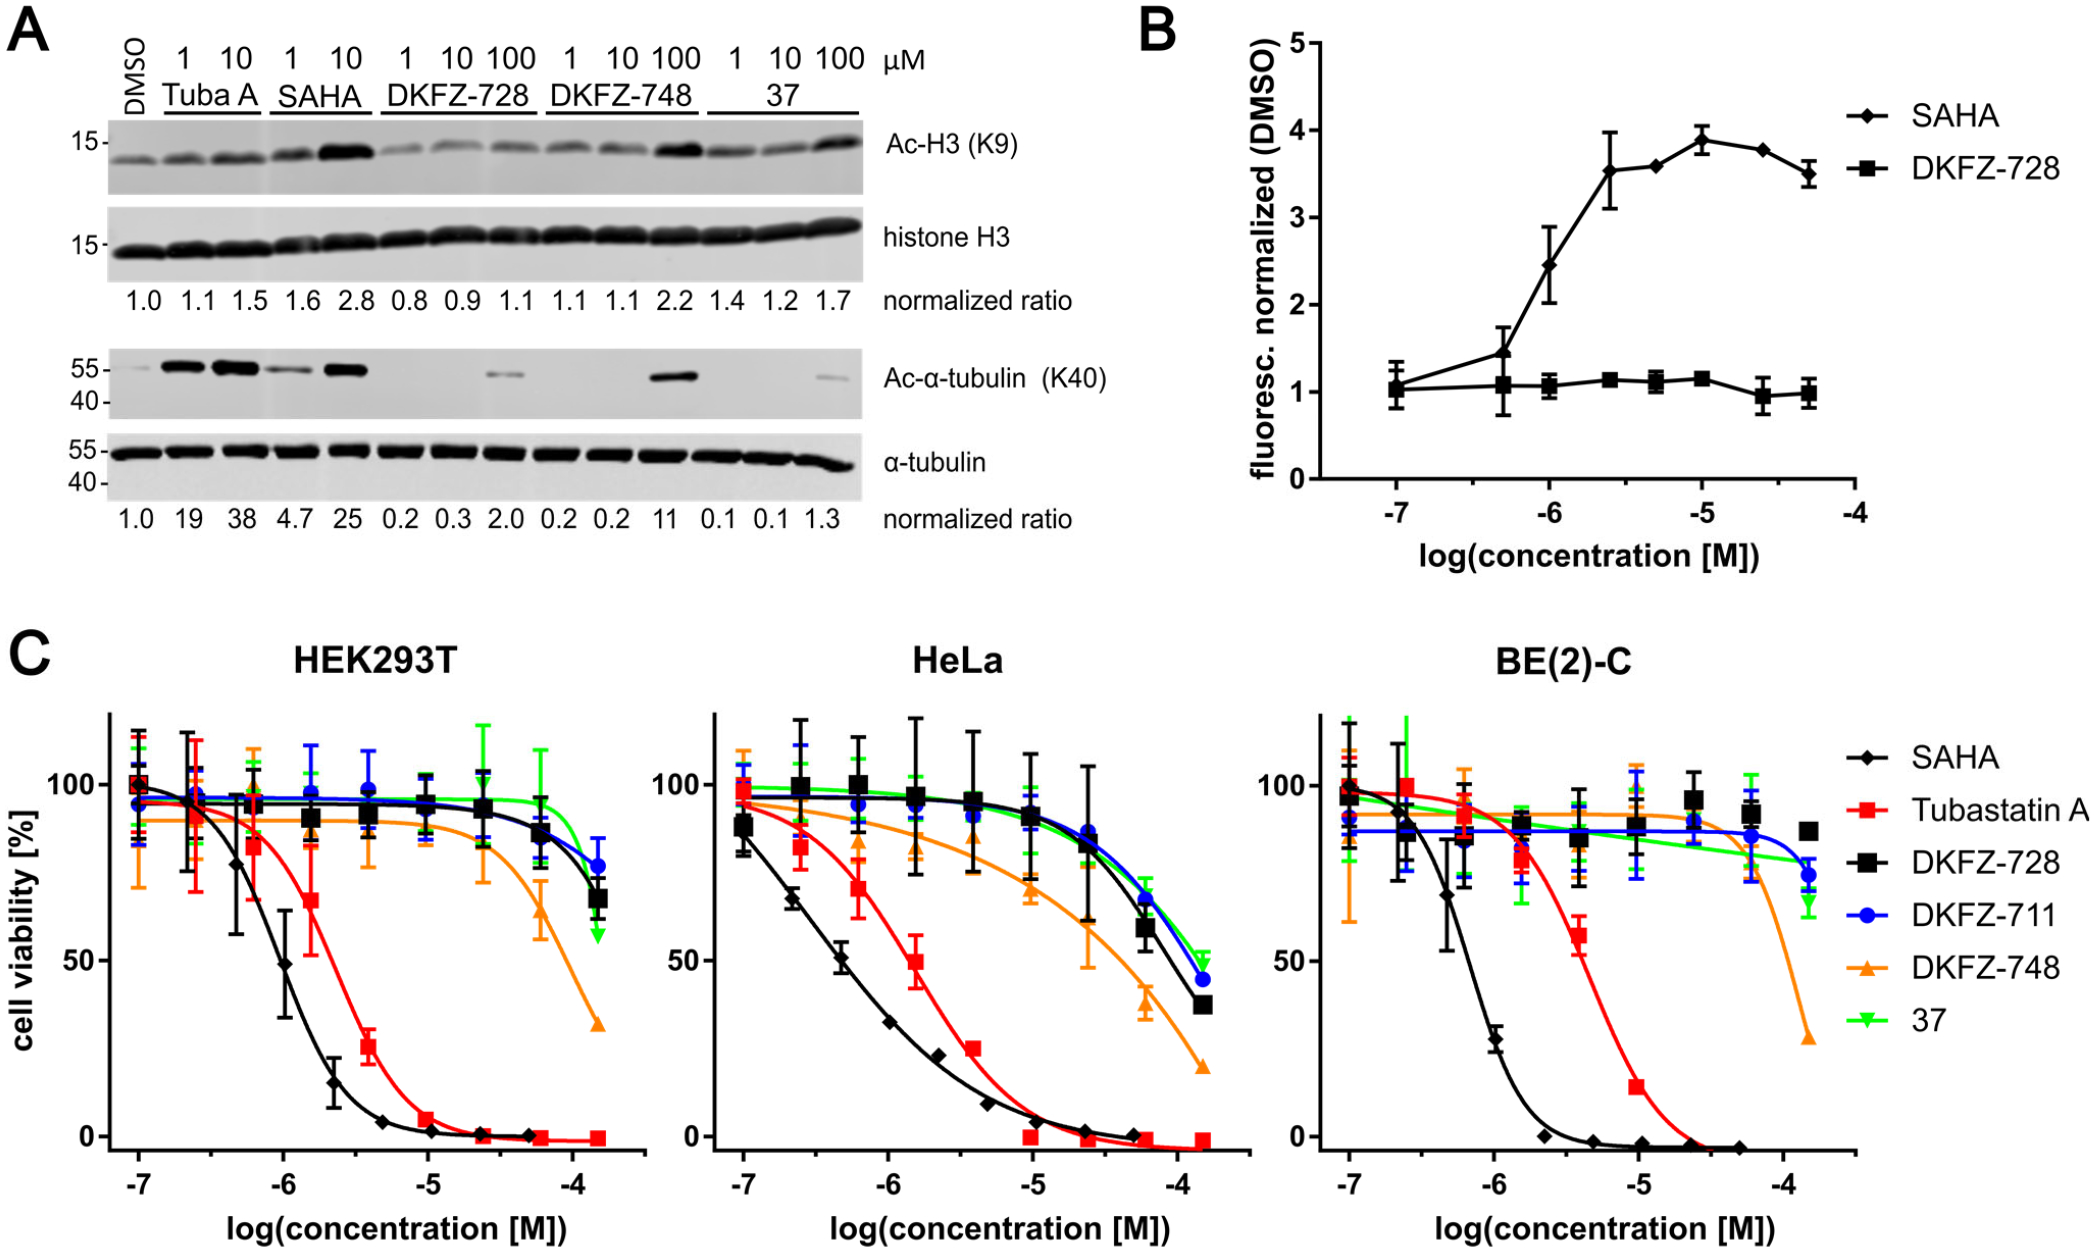
A: Acetylation Western blots of histone H3 and α-tubulin from BE(2)-C cells demonstrates no off-target hyperacetylation at concentrations required for full inhibition of HDAC10. Whole blots of two independent biological replicates are provided in Figure S3. B: HDAC10-selective DKFZ-728 does not lead to acidification of the lysosomal compartment, a previously used measure of HDAC10 interference. Shown by increased fluorescence from the LysoTracker DND-99 probe in BE(2)-C cells, represented as mean with range of two independent experiments. C: No cytotoxicity (Cell-Titer-Blue) associated with HDAC10 inhibition in three representative cell lines is observed after 72 h treatment, in contrast to SAHA (pan-inhibitor) and tubastatin A (HDAC6/10 selective).