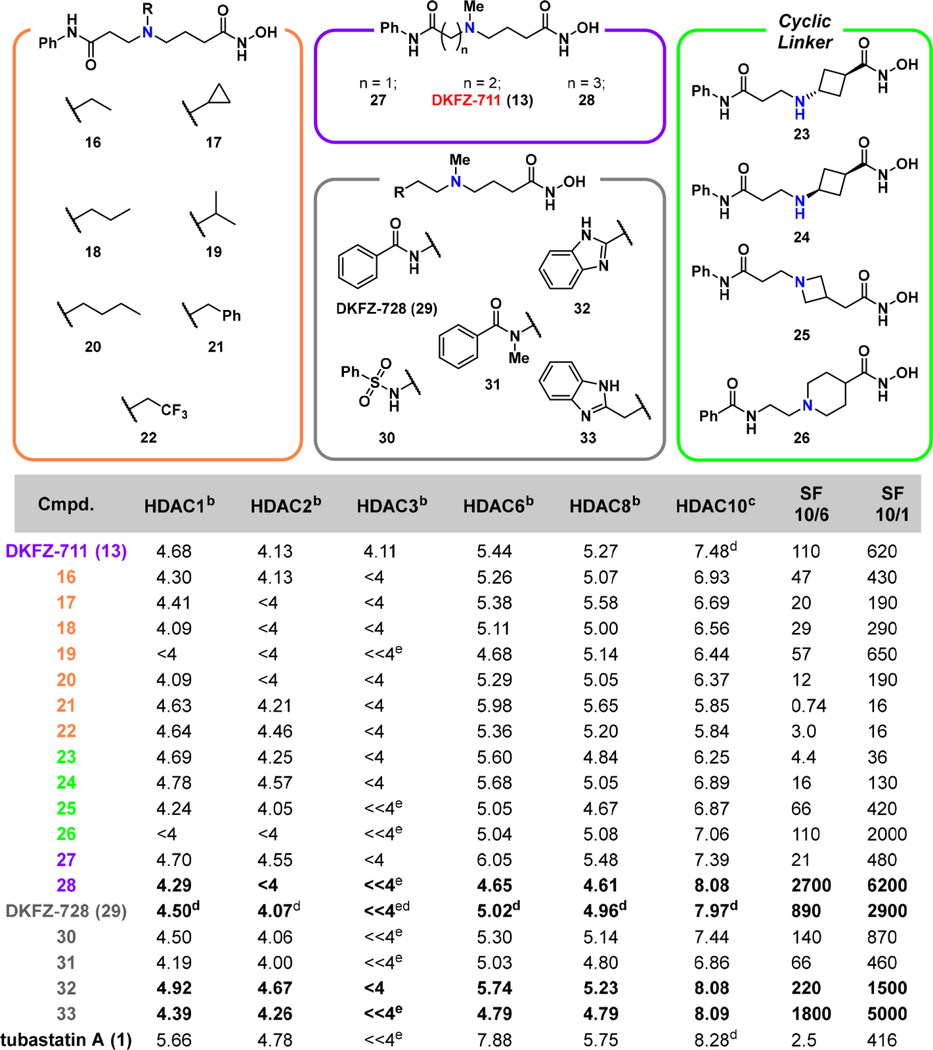
Table 1.
pIC50 valuesa of γ-amino hydroxamic acids.

|
pIC50 values are the mean of two replicates, each determined by four-parameter non-linear regression analysis with eight dose levels in triplicate with HDAC Glo assayb or FRET assayc.
Mean of at least three individual experiments.
Curve fit analysis not convergent at 100 μM. SF (selectivity factor) = 10(pIC50(HDAC10) − pIC50(HDAC6 or 1)) rounded to two significant figures. Activity profile for the best HDAC10 inhibitors are highlighted in bold. For an extended version of this table with 95% confidence intervals, see Table S2.
