
Figure 8.
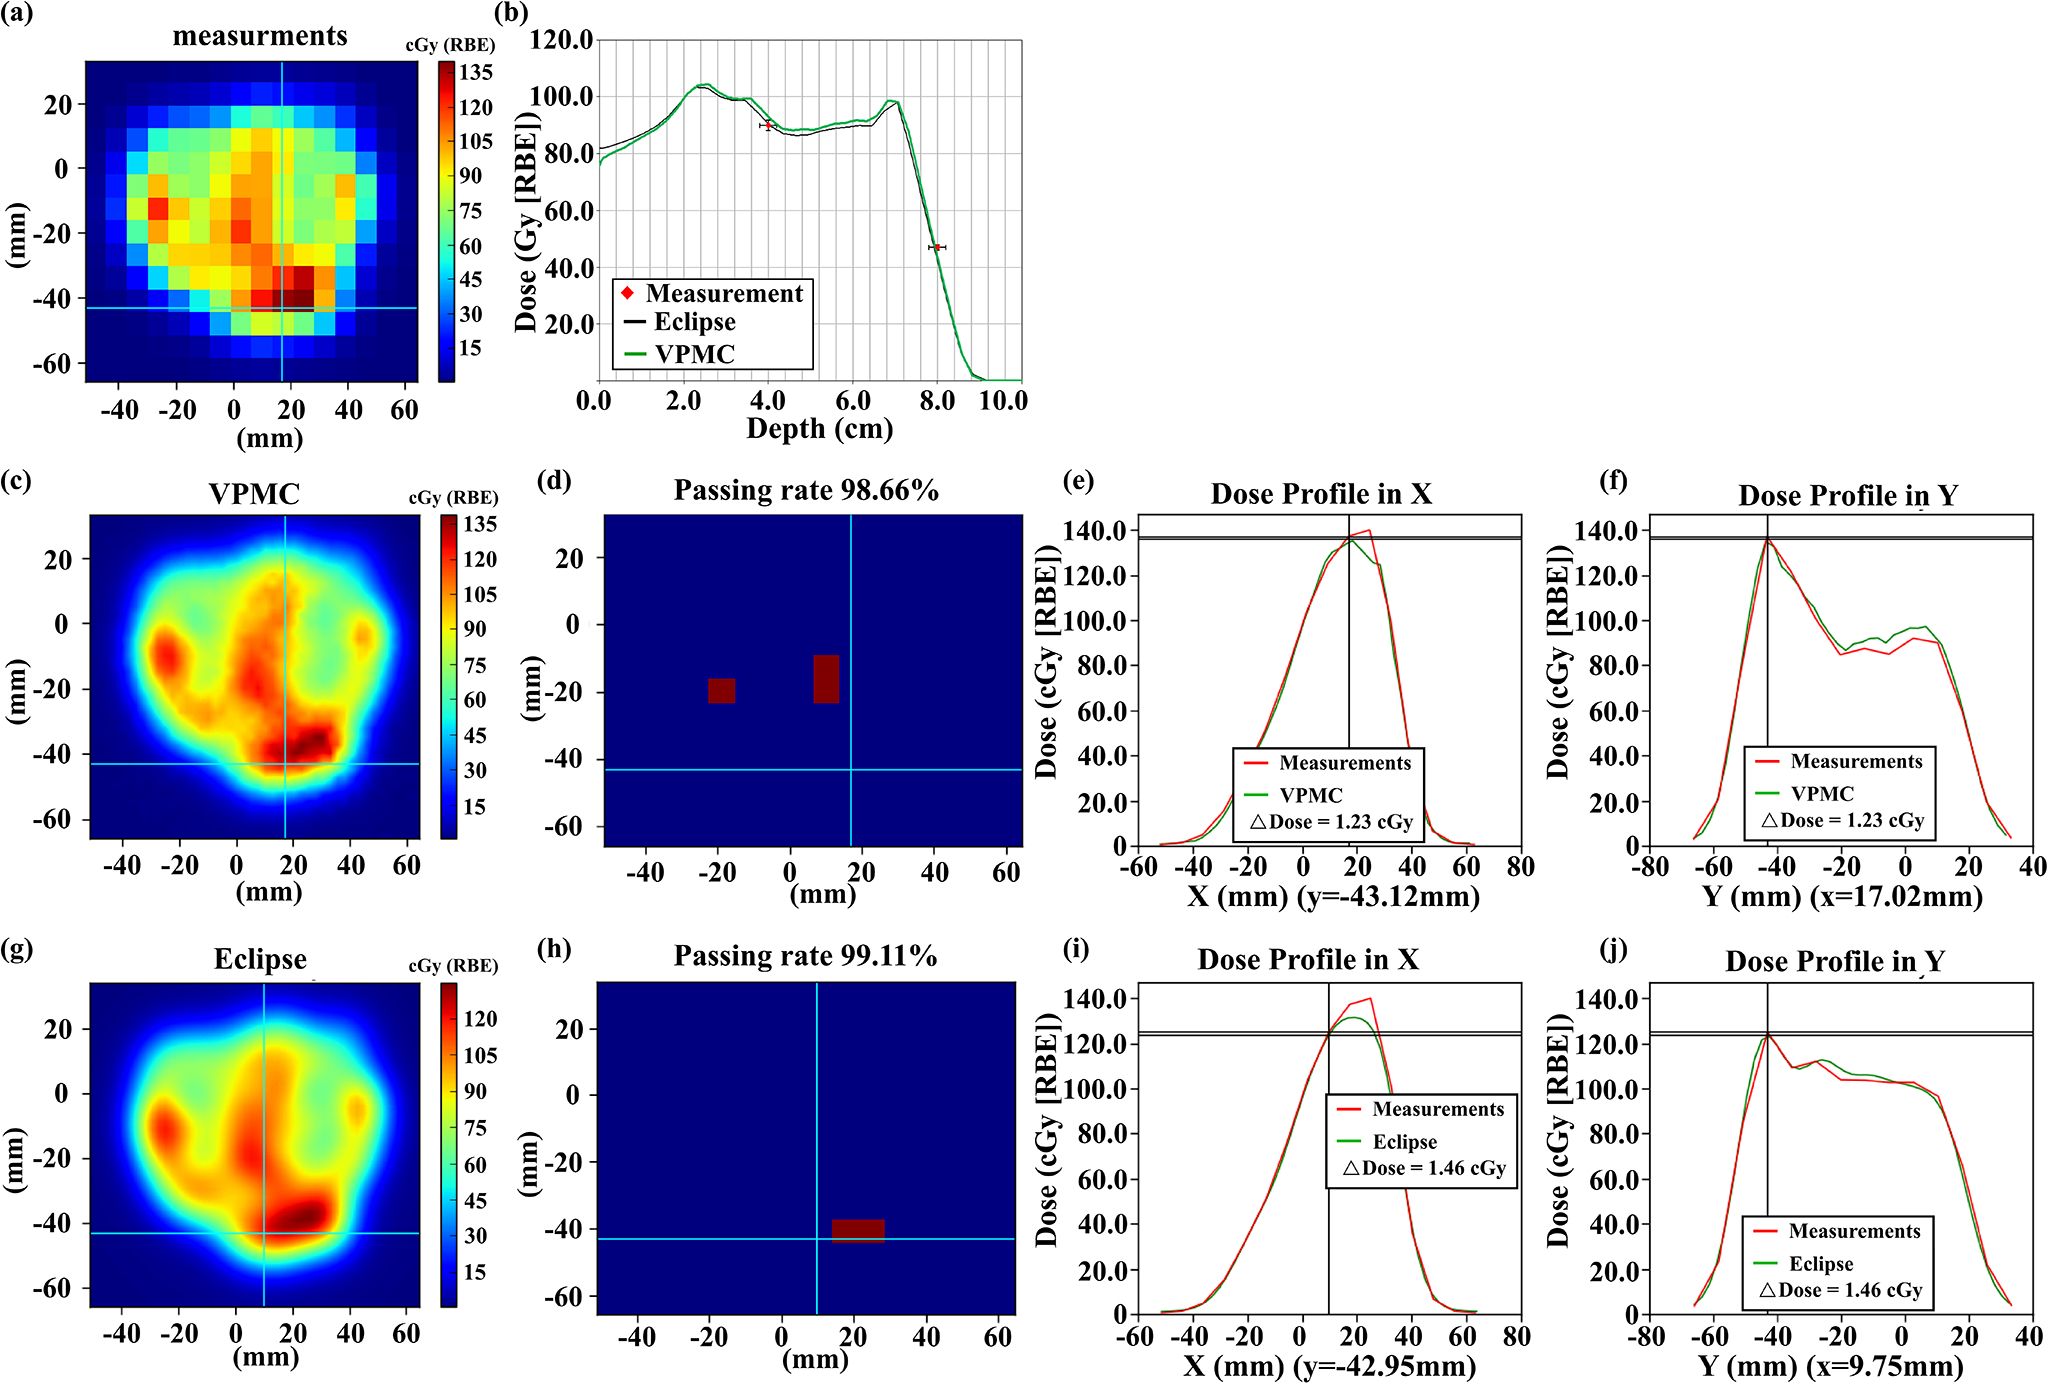
Comparisons of the measured 2D plane dose during PSQA (a) with VPMC calculation result (c), and Eclipse™ calculation result (g) at a depth of 4.0 cm for a lung cancer patient without range shifter. The corresponding 2D-3D Gamma analysis pass/fail maps are shown in (d) and (h) with 3%/2mm/10%. Subpanel (b) displays the dose profiles from VPMC and Eclipse™ in the beam direction. The black line is from the Eclipse™ calculation result, while the green line is from the VPMC calculation result. Red points are the measured results with an error bar of 2%/2mm. Subpanel (e) (f) displays the dose profile comparison between the VPMC calculated dose and the measured dose in the X direction at the Y position indicated by the horizonal line in (c) and in the Y direction at the X position indicated by the vertical line in (c), respectively. Subpanel (i) (j) displays the dose profile comparison between the Eclipse™ calculated dose and measured dose in the X direction at the Y position indicated by the horizonal line in (g) and in the Y direction at the X position indicated by the vertical line in (g), respectively. RBE = 1.1.