
Figure 2. In vivo growth characteristics of LCMV-MN.
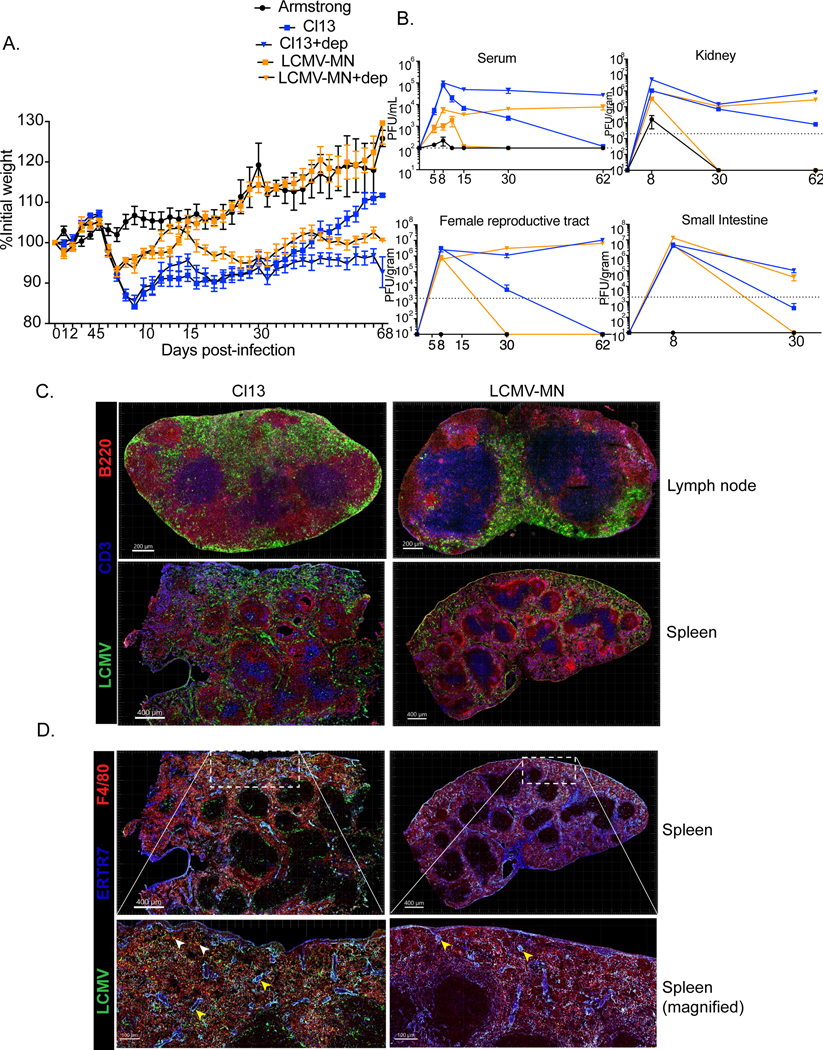
C57Bl/6 mice were either treated with anti-CD4 antibody (0.5mg/mouse 1 day before and 1 day after infection) or remained untreated and were infected with 2 X10⁶ PFU of LCMV-MN or 2 X10⁶ PFU of LCMV-Cl13 i.v. Another group of mice were infected with 2X10⁵ PFU of LCMV-Armstrong i.p. to establish acute infection. (A) Kinetics of weight loss among the 5 groups of mice during the first 68 days post-infection. Weight measurement was done every day for the first 15 days and then every 2–3 days. (B) Kinetic analysis of virus titer in serum (in PFU/ml), kidney, female reproductive tract and small intestine (all in PFU per gram of tissue) for the 5 separate infections. The limit of detection is indicated by the dashed line. (C&D) Mice were infected with LCMV-Cl13 or LCMV-MN and then examined 35 days later by immunofluorescence microscopy. (C) Representative images of lymph node (top) and spleen (bottom) (LCMV-nucleoprotein, green; CD3, blue; B220, red). (D) Comparison of LCMV nucleoprotein distribution among splenic fibroblastic reticular cells and macrophages (LCMV-nucleoprotein, green; ERTR7, blue; F480, red). Yellow arrowhead-colocalization of LCMV-nucleoprotein and ERTR7 signal. White arrowhead- colocalization of LCMV-nucleoprotein and F480 signal. Data are representative of two separate experiments with either n=5 mice/group per experiment (A and B) or n=3 mice/group per experiment (C and D). Bars indicate mean ± SEM.