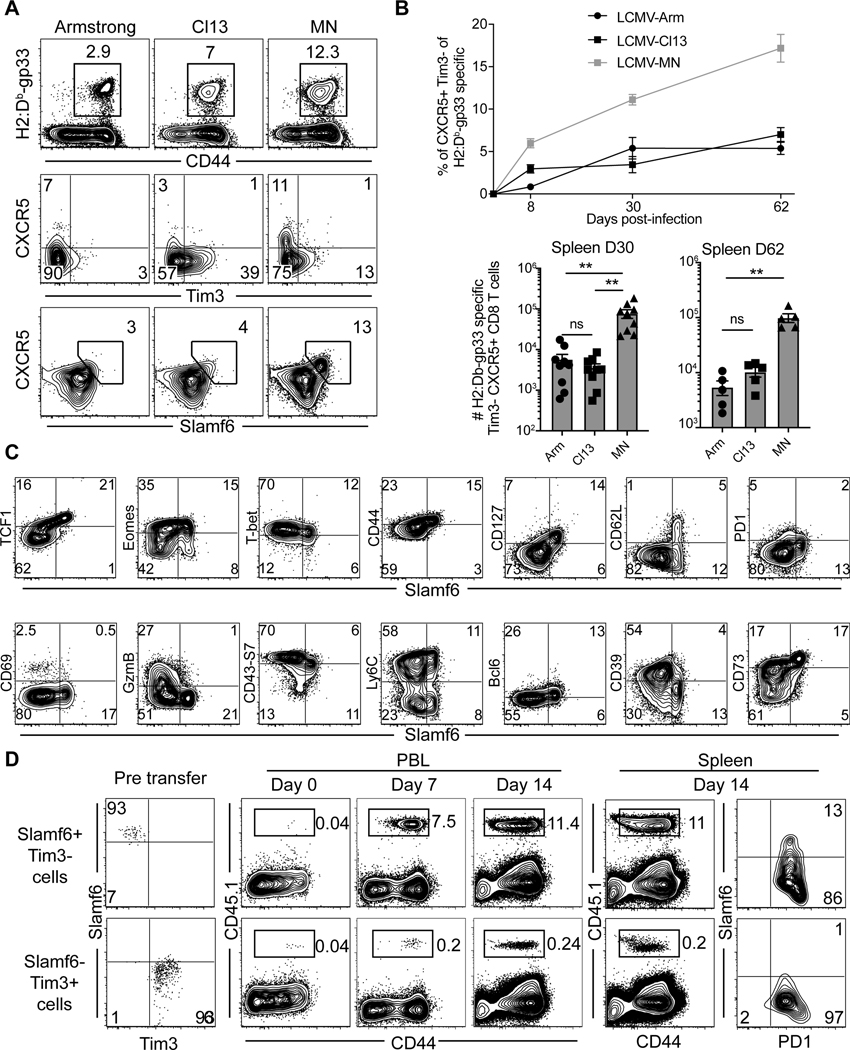
Figure 6. LCMV-MN infection enhances development of Slamf6+ progenitor exhausted CD8 T cells.
(A) Representative flow plots depicting H-2Db/gp33-specific CD8 T cell frequency (top), expression of Tpex markers on antigen-specific CD8 T cells (middle and bottom) in spleen of animals infected with indicated LCMV strains 30 days before. Top panel is gated on live CD8 T cells whereas the bottom two panels are gated on gp33 tetramer+ CD8 T cells in spleen. (B) Kinetics of Tpex CD8 T cells in spleen (top) and their numbers at day 30 and day 60 post-infection (bottom). (C) Representative flow plots showing expression of various phenotypic markers associated with the progenitor population in LCMV-MN infected animal (30 days post-infection). Plots are gated on gp33 tetramer+ CD8 T cells in spleen. (D) Congenically marked PD1+ Slamf6+ Tim3− and PD1+ Slamf6- Tim3+ CD8 T cells from LCMV-MN infected mice (Day 30 PI) were isolated by cell sorting and transferred i.v. to 2 groups of congenically distinct naive mice followed by LCMV-MN infection. Representative flow plots depicting expansion of transferred cells in blood on indicated days and their frequency and phenotype in spleen at 14 days post-infection. Data are representative of two separate experiments with n=4–5 mice/group per experiment per group. Bars indicate mean ± SEM. **p <0.001, ns-not significant. Kruskal Wallis one-way ANOVA with Dunn’s multiple comparison test.

