
Figure 2:
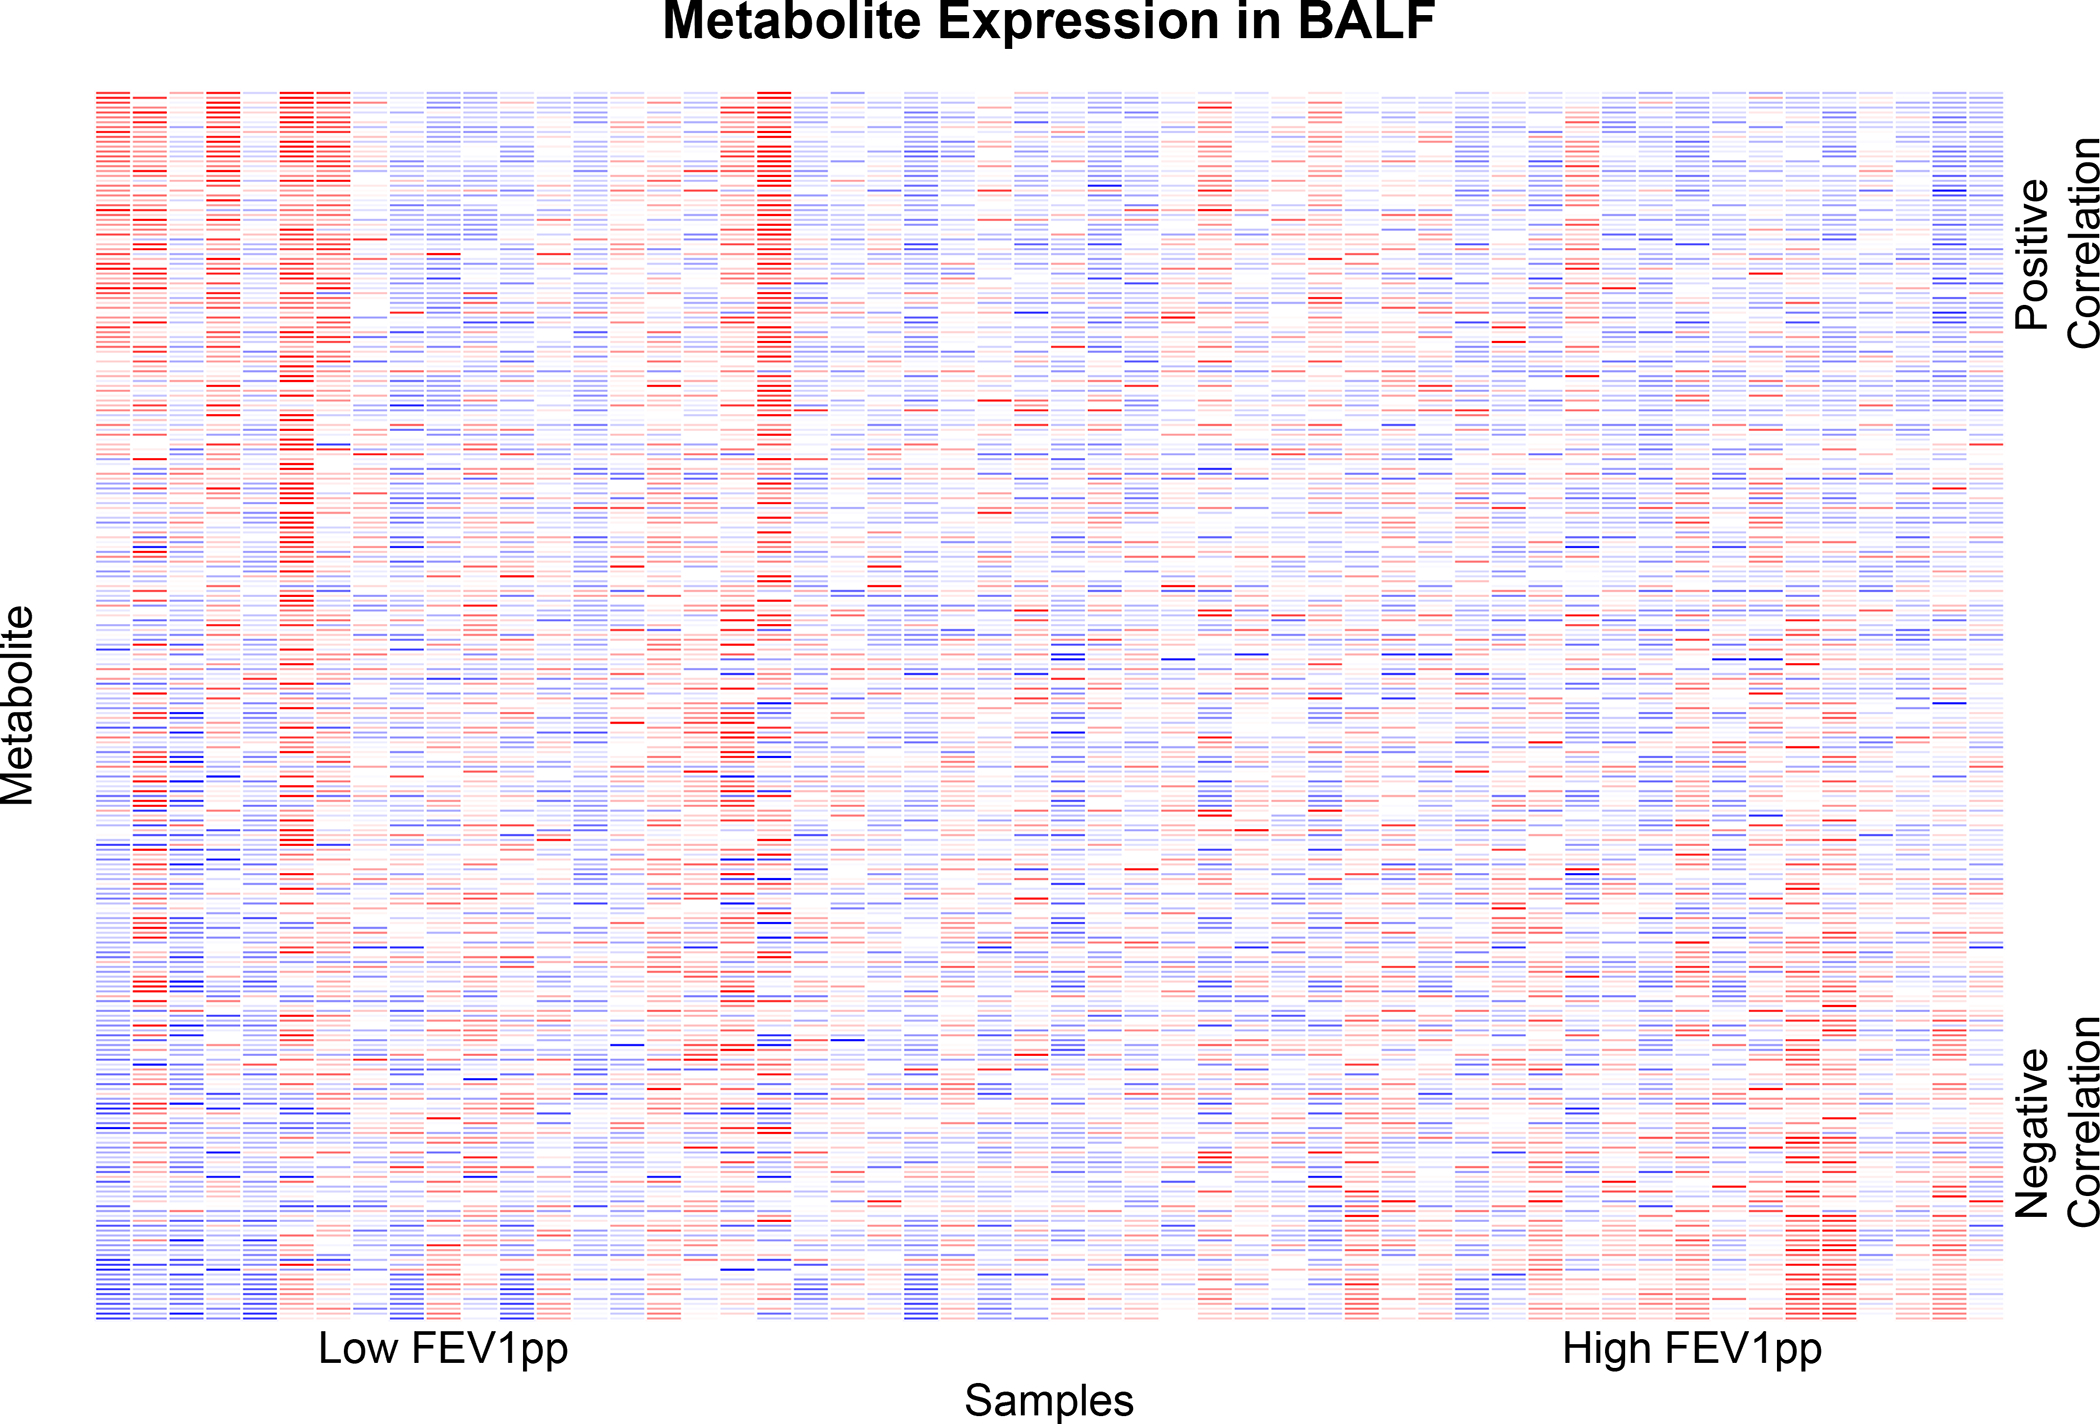
Heatmap showing metabolite expression for the study cohort. Columns reflect samples and rows reflect metabolites. The metabolites are ordered by the direction and magnitude of their correlation with FEV1pp.
Official websites use .gov
A
.gov website belongs to an official
government organization in the United States.
Secure .gov websites use HTTPS
A lock (
) or https:// means you've safely
connected to the .gov website. Share sensitive
information only on official, secure websites.
Heatmap showing metabolite expression for the study cohort. Columns reflect samples and rows reflect metabolites. The metabolites are ordered by the direction and magnitude of their correlation with FEV1pp.