
Figure 3. Screening and evaluation of BRD4 degrader library.
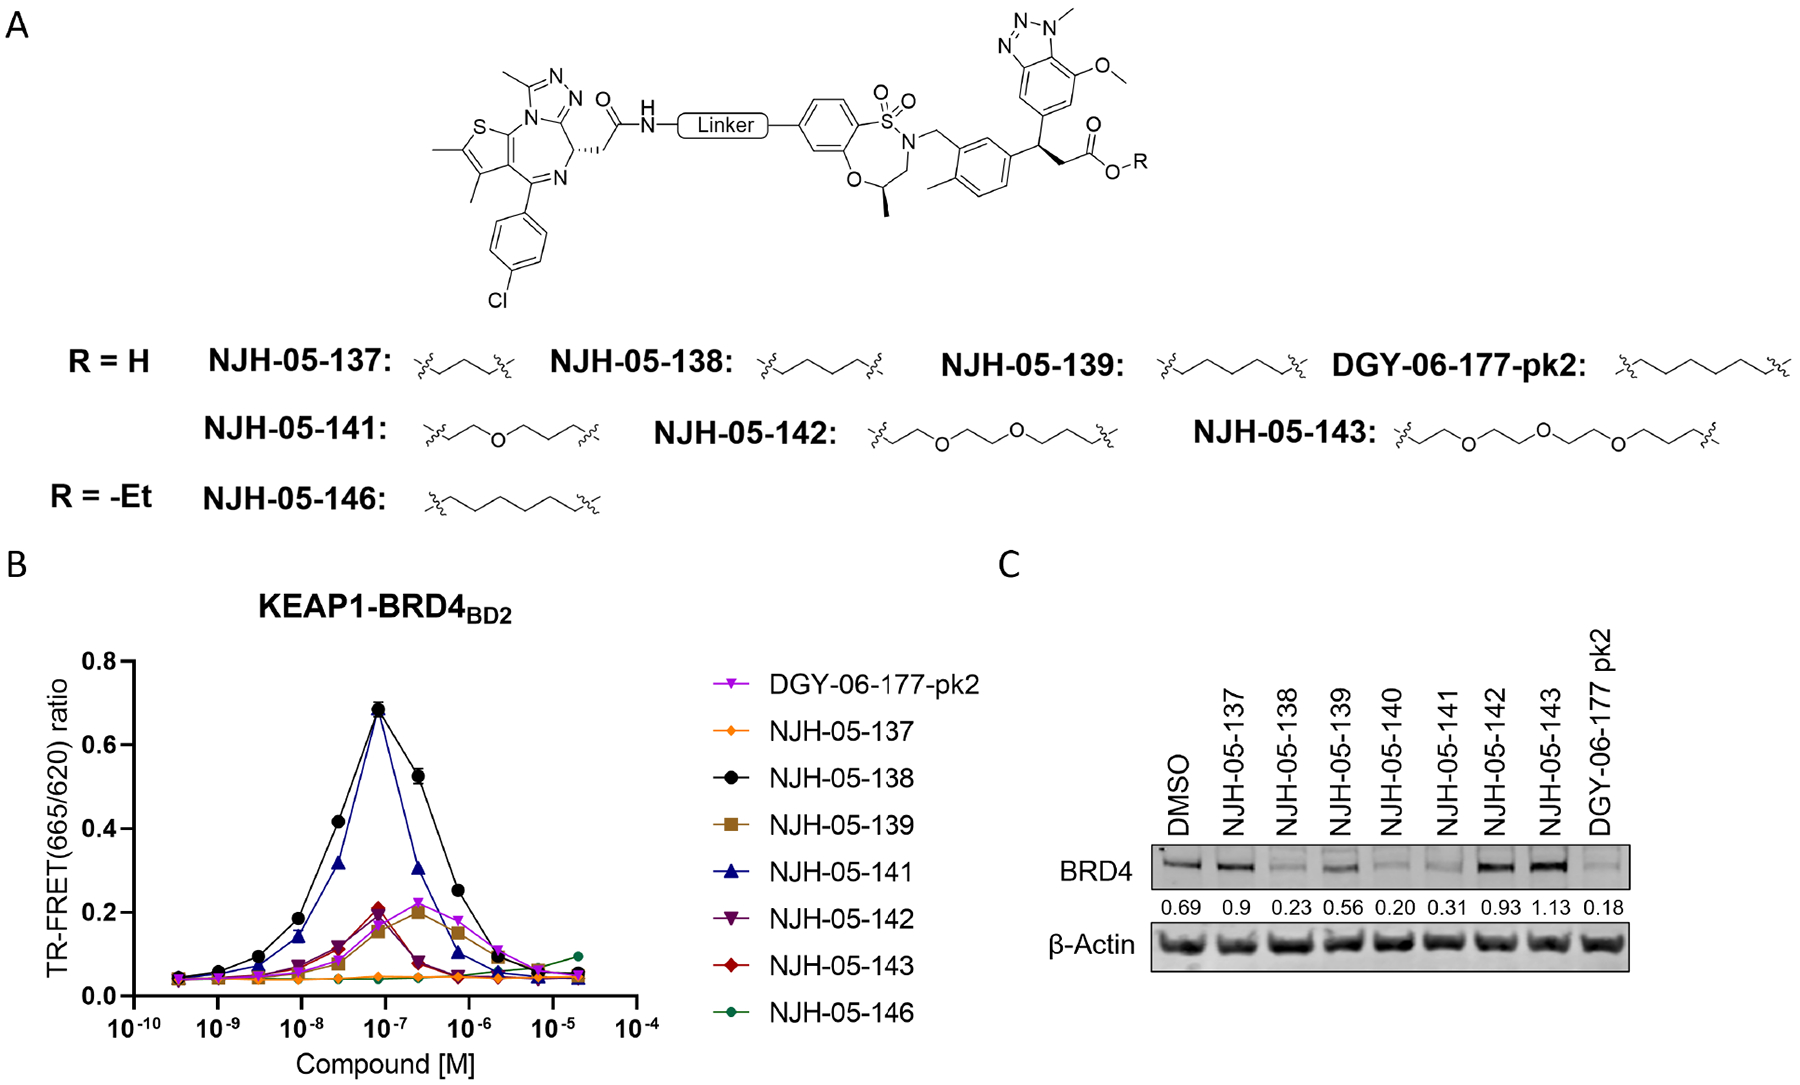
A. Structure of KEAP1-BRD4 compounds B. KEAP1-BRD4BD2 dimerization TR-FRET assay. Titration of indicated compounds to Alexa Fluor™ 647-KEAP1, Eu-streptavidin and biotinylated BRD4BD2. Data are presented as mean ± SD with at least three technical replicates. Representative figure from two independent experiments is shown. C. Immunoblot assessment of MM.1S cells treated with either DMSO or the indicated compounds for 16 h. Representative blots from two independent experiments are shown. The relative intensity of each band (BRD4 normalized to β-actin) is shown under each band (NJH-05–140 was another batch of DGY-06–177-pk2).