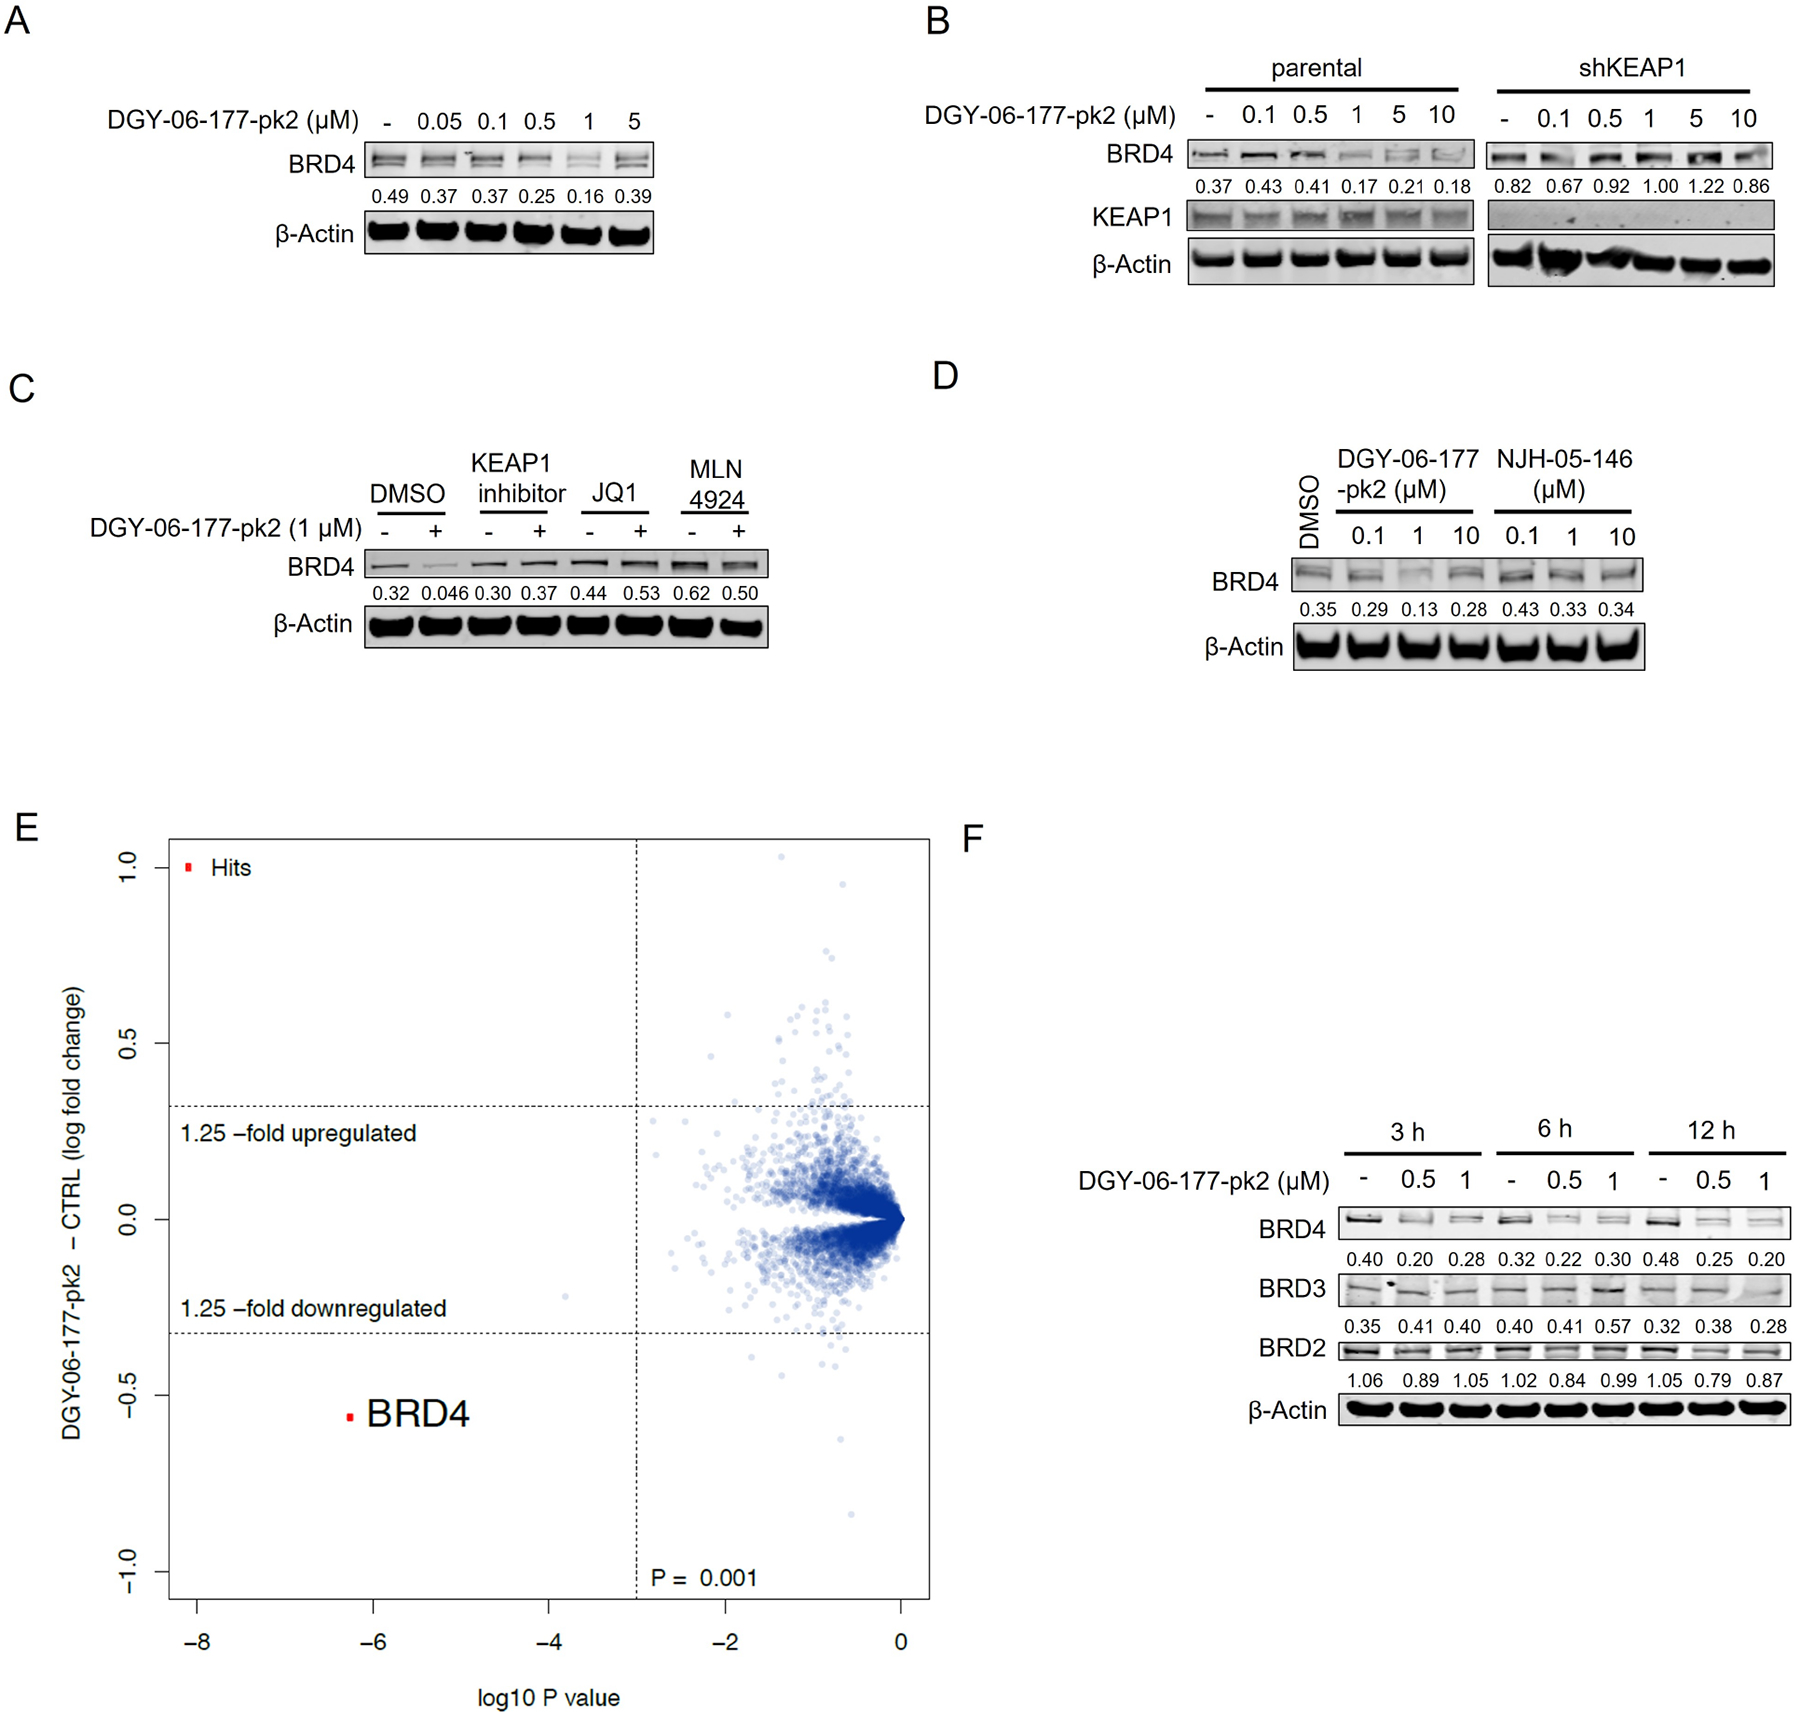
Figure 4. Validation of the lead degrader molecule, DGY-06–177-pk2.

A. Immunoblot assessment of MM1.S cells treated with indicated doses of DGY-06–177-pk2 for 16 h. Representative blots from two independent experiments are shown. The relative intensity of each band (BRD4 normalized to β-actin) is shown under each band. B. Immunoblot assessment of parental and KEAP1 knockdown OVCAR8 cells treated with either DMSO or DGY-06–177-pk2 for 16 h. Representative blots from two independent experiments are shown. The relative intensity of each band (BRD4 normalized to β-actin) is shown under each band. C. Immunoblot assessment of MM.1S cells pretreated with 10 μM of KEAP1 inhibitor, 10 μM of JQ1, 1 μM of MLN4924 for 2 h prior to the addition of DGY-06–177-pk2 for 16 hrs. Representative blots from two independent experiments are shown. The relative intensity of each band (BRD4 normalized to β-actin) is shown under each band. D. Immunoblot assessment of MM.1S cells treated with either DMSO, DGY-06–177-pk2 or its negative control compound at indicated doses for 16 h. Representative blots from two independent experiments are shown. The relative intensity of each band (BRD4 normalized to β-actin) is shown under each band. E. Quantitative proteomics profiles of wild-type MM.1S cells treated for 6 h with 0.2 μM of DGY-06–177-pk2. F. Immunoblot assessment of MM.1S cells treated with either DMSO or DGY-06–177-pk2 for the indicated time points. Representative blots from two independent experiments are shown. The relative intensity of each band (BRD4/3/2 normalized to β-actin) is shown under each band. See also Figure S2.
