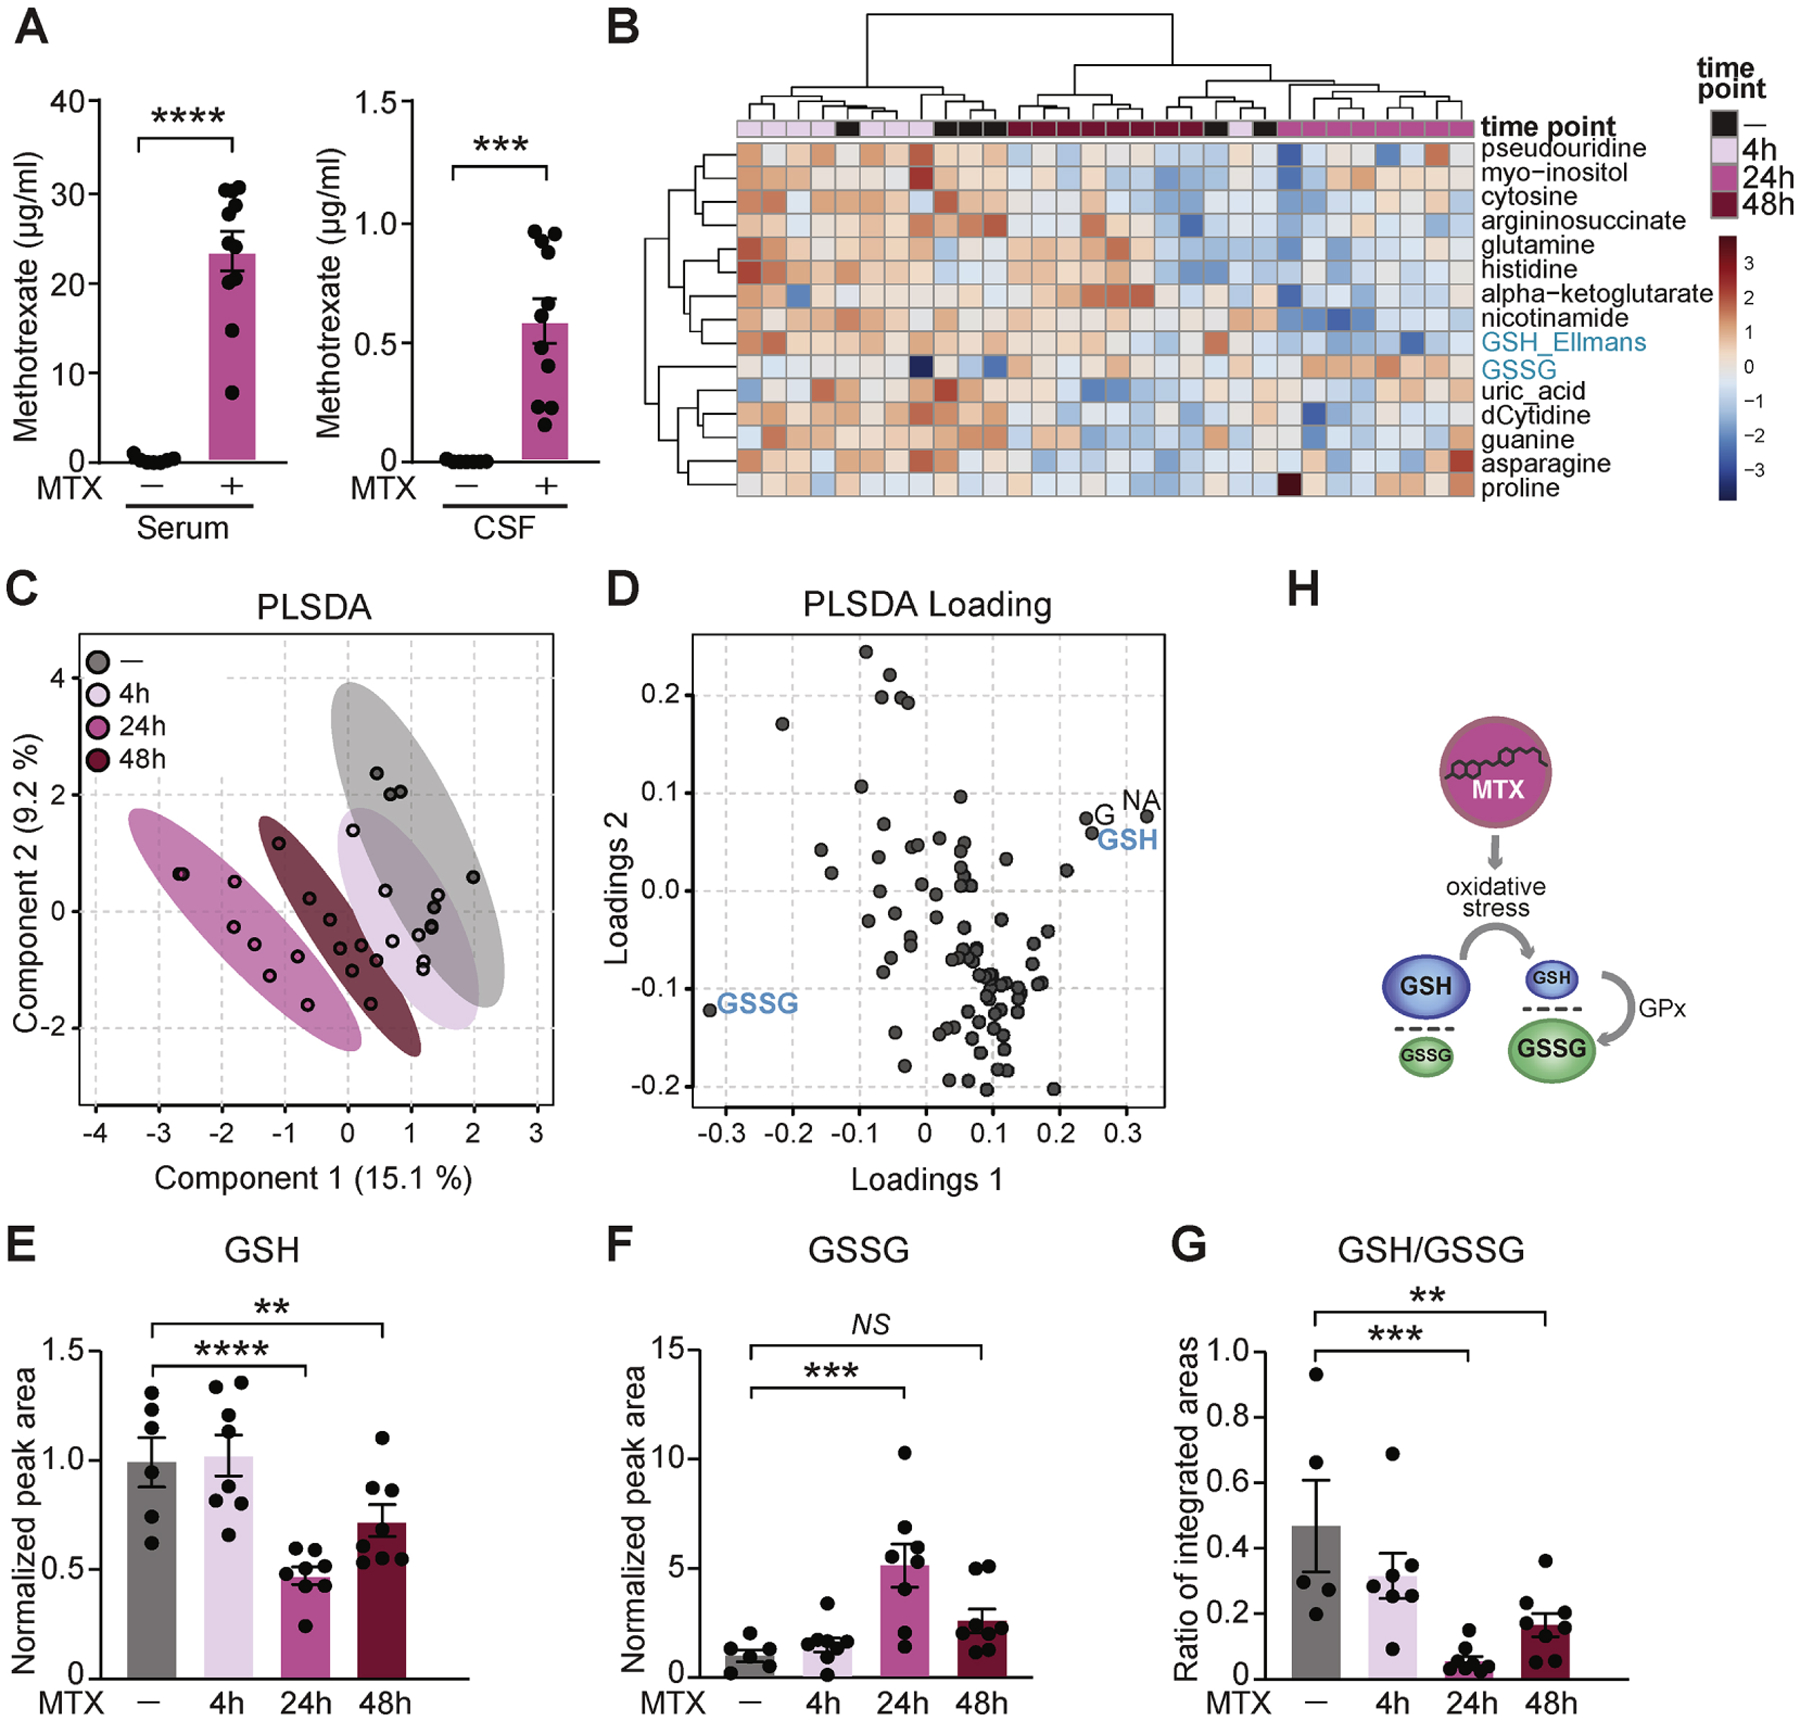
Figure 1. CSF of MTX-treated mice is metabolically altered and reflects markers of oxidative stress.

(A) Serum (left) and CSF (right) concentrations of MTX were measured 30 min following a single MTX dose (75 mg/kg i.v.) by ELISA. n = 7 vehicle (saline), n = 11 MTX. ***P < 0.001, ****P < 0.0001. Unpaired t test. (B) Metabolite profiling of CSF by LC-MS analysis of vehicle- and MTX-treated mice following 4 h, 24 h, and 48 h MTX exposure. Top 15 changed metabolites are shown. The heatmap represents log-transformed, Pareto-scaled levels of each of the listed metabolites in the four cohorts (4 h, 24 h, and 48 h following MTX treatment, and “ctrl”, 48 h post vehicle delivery). (C) PLSDA analysis of the metabolomics data. (D) PLSDA loading plot with highlighted metabolites indicating the most influential data points located on the outermost areas along the direction of separation as identified in the corresponding score plot in C. GSSG – glutathione disulfide, GSH – glutathione (measured as a conjugate of glutathione-Ellmans, see Star methods), G – guanine, NA – nicotinic acid. Plots were generated by MetaboAnalyst (Chong et al., 2019). (E, F, G) Levels of reduced (GSH, E), oxidized (GSSG, F), and the ratio of reduced to oxidized glutathione (GSH/GSSG, G) in mouse CSF treated with vehicle or MTX for 4 h, 24 h, and 48 h. n = 6 vehicle, n = 8 MTX (all time points). **P < 0.01, ***P < 0.001, ****P < 0.0001; NS, not significant. One-way ANOVA test with Benjamini, Krieger, Yukutieli FDR. (H) Schematic depicting the change in GSH/GSSG ratio as a consequence of oxidative stress. GPx, Glutathione peroxidase. Data represent mean ± SEM.
