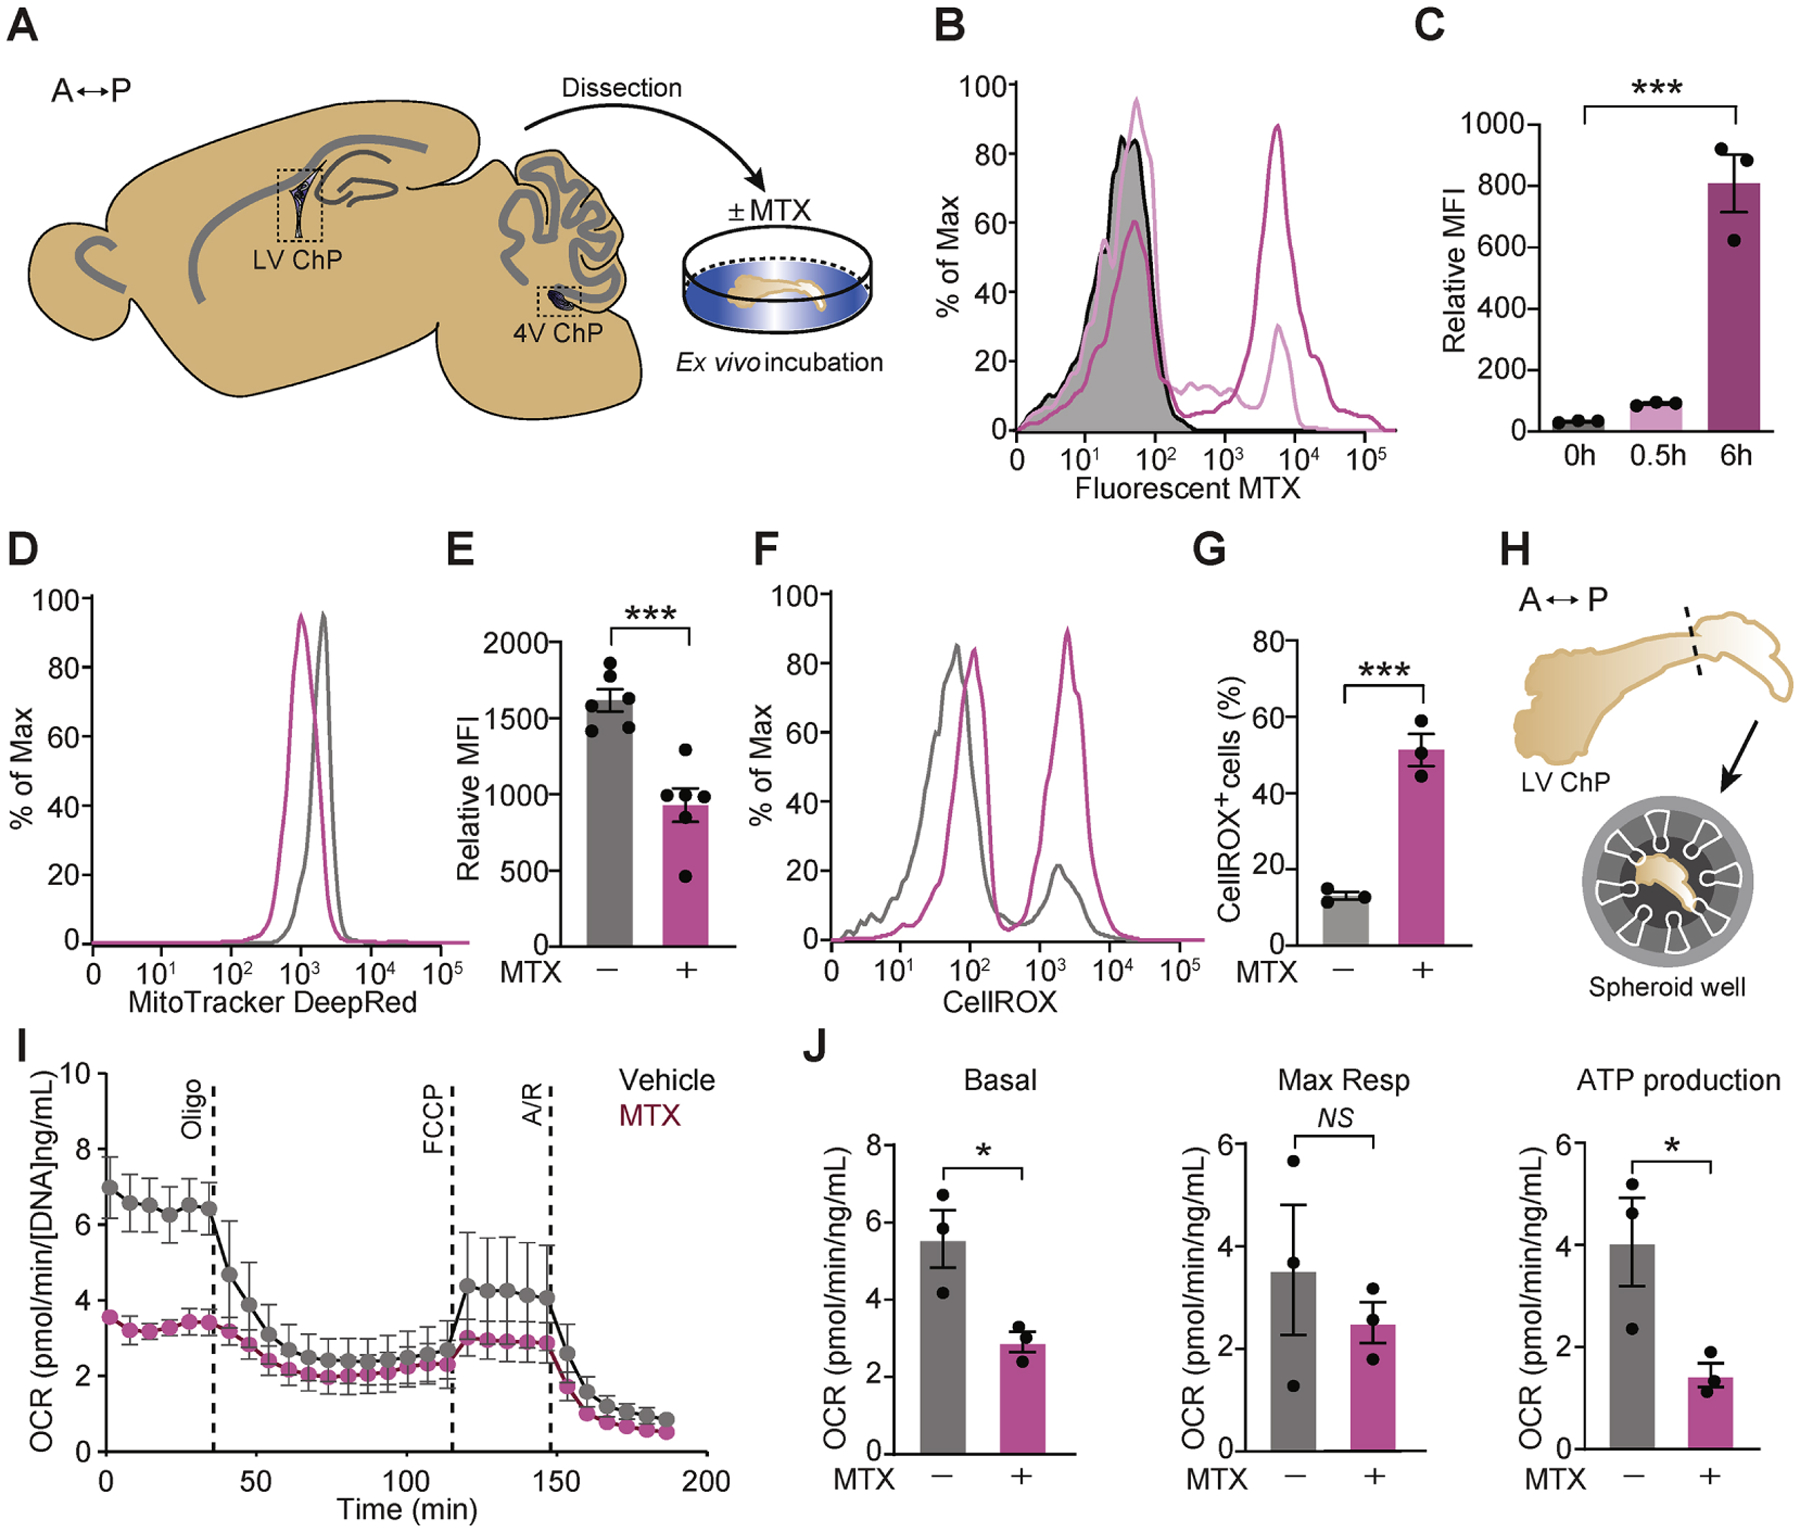
Figure 2. MTX treatment induces oxidative stress in the ChP.

(A) A sagittal plane schematic of adult mouse brain depicting the ChP areas dissected for culture and downstream analyses ex vivo. Double-headed arrow orients along the anterior (A)–posterior (P) axis. (B, C) Flow cytometry analysis of cells from mouse lateral ventricle (LV) ChP following incubation with 2 μM fluorescent MTX at the designated time points. A representative histogram (B) and mean fluorescence intensity (MFI) of fluorescent MTX (C) are shown. n = 3 per group. ***P < 0.001. One-way ANOVA with Tukey’s post hoc test. (D, E) MitoTracker Deep Red staining of mouse LV ChP following treatment with vehicle or 10 μM MTX for 2 h. Results were analyzed by flow cytometry. A representative histogram (D) and mean fluorescence intensity (MFI) of the MitoTracker signal (E) are shown. n = 6 per group. ***P < 0.001. Unpaired t test. (F, G) ROS were assessed by CellROX staining of mouse LV ChP following incubation with vehicle or 10 μM MTX for 4 h. Results were analyzed by flow cytometry. A representative histogram (F) and the percent CellROX-positive cells (G) are shown. n = 3 per group. ***P < 0.001. Unpaired t test. (H) Schematic depicting assay of mitochondrial function using Agilent Seahorse XFe96 test, anterior (A) – posterior (P) axis. (I, J) Mouse LV ChP was analyzed by Seahorse following 2 h of vehicle or 10 μM MTX. Cellular oxygen consumption rate (OCR) normalized to total DNA content is shown for vehicle (grey dots) or MTX-treated (pink dots). Representative time course data (I) and aggregate data (J) are shown. n = 3 per group. *P < 0.05; NS, not significant. Unpaired t test. Oligo, oligomycin; FCCP, carbonyl cyanide-4-(trifluoromethoxy) phenylhydrazone; A/R, antimycin A plus rotenone; Resp., respiratory. Data represent mean ± SEM.
