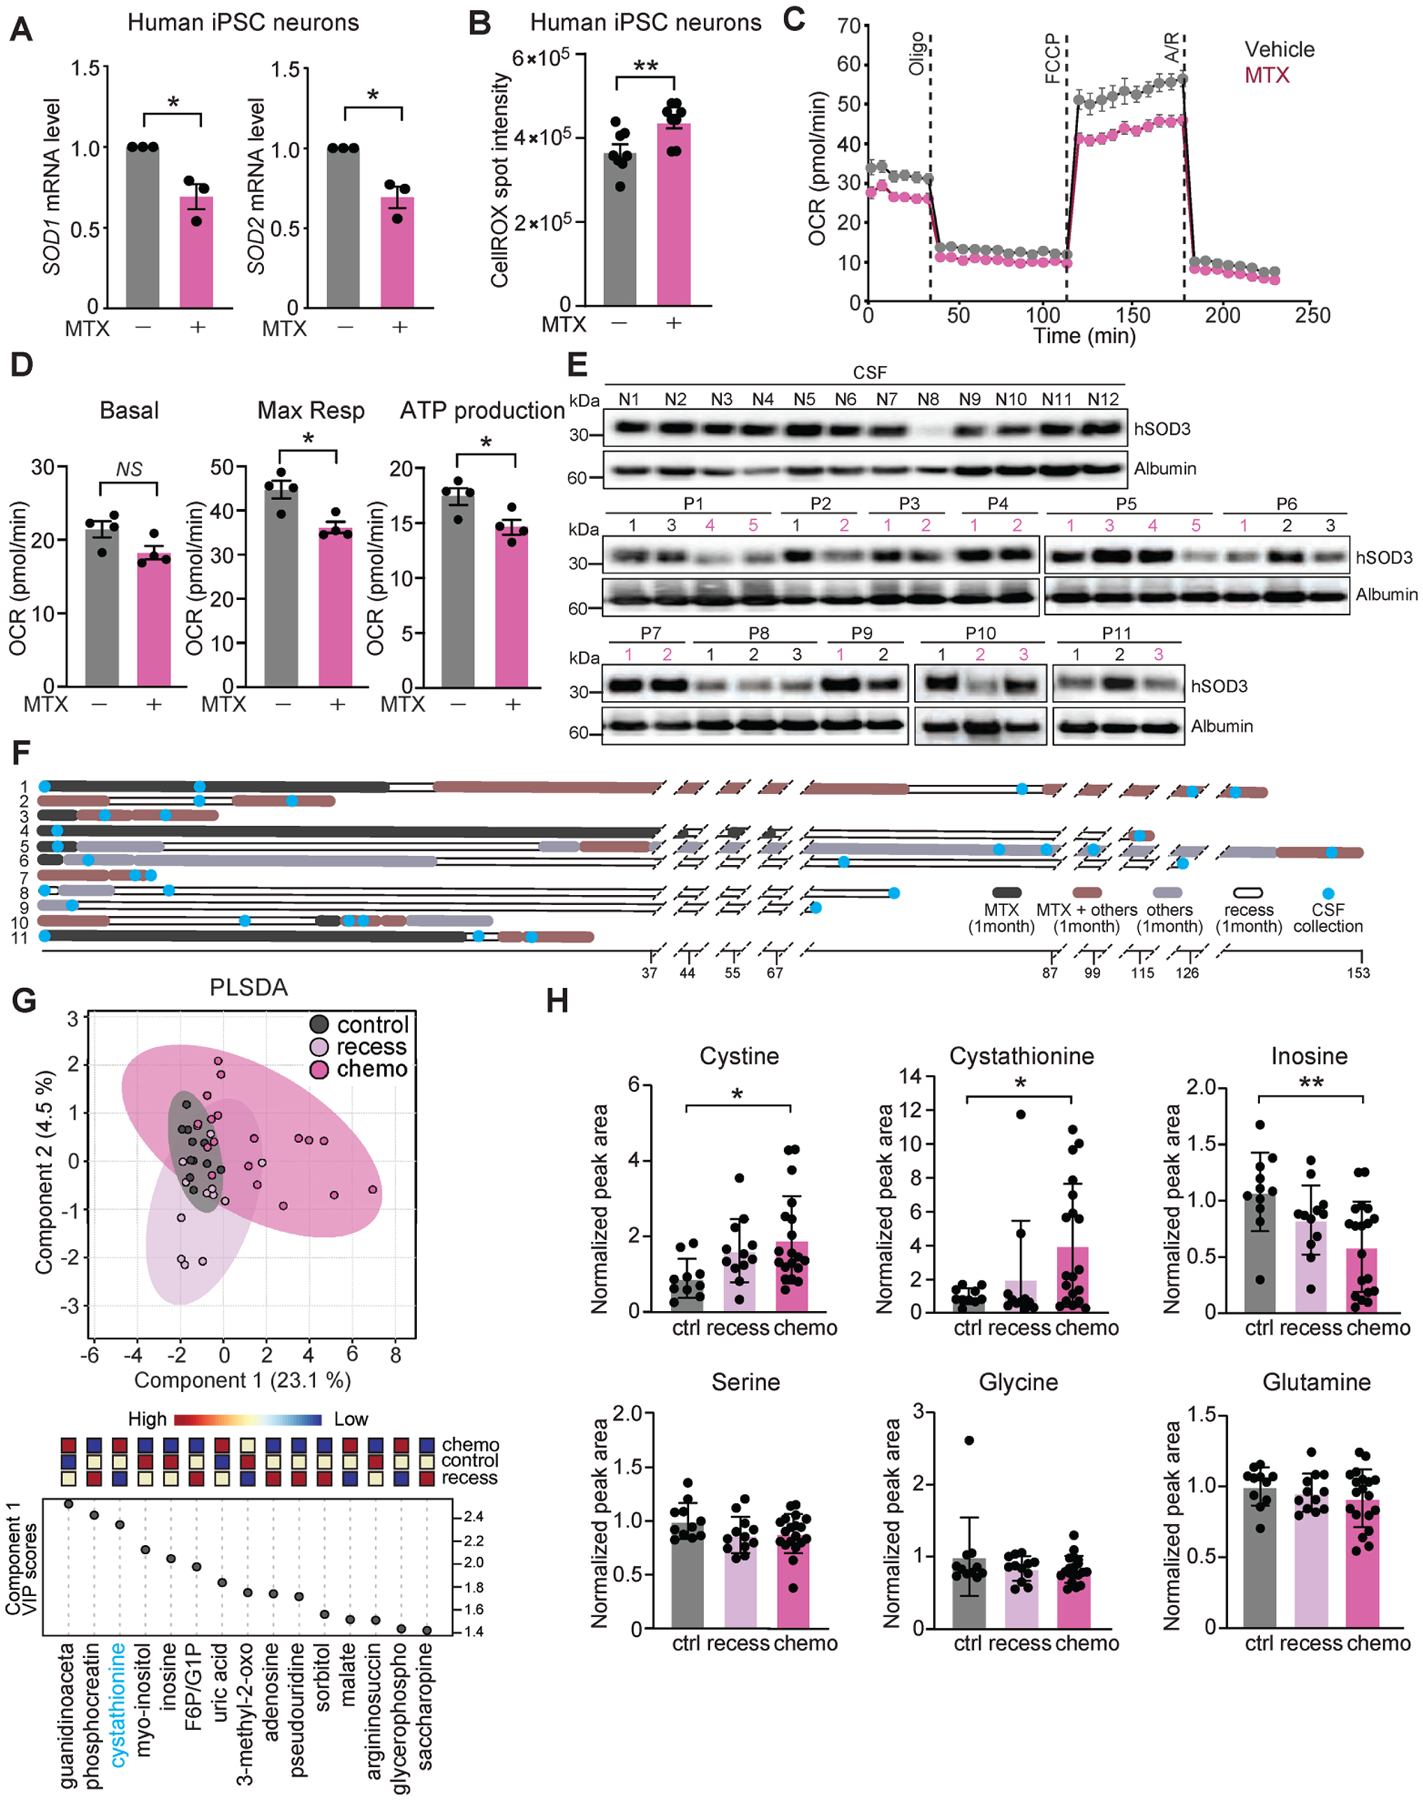
Figure 6. MTX treatment renders human neurons susceptible to oxidative stress, and patient CSF reveals reduced SOD availability and altered redox homeostasis during MTX treatment.

(A) Expression levels of SOD1 and SOD2 measured by qRT-PCR in human iPSC-derived cortical neurons following vehicle or 10 μM MTX treatment for 24 h. n = 3, *P < 0.05. Mann-Whitney. (B) ROS levels were assessed by CellROX staining using ArrayScan in human iPSC-derived neurons following 72 h of vehicle or 10 μM MTX treatment. n = 8 per group. **P < 0.01. Unpaired t test. (C-D) Mitochondrial function of vehicle- (grey dots) or MTX-treated (10 μM, pink dots) human iPSC-derived neurons assessed by OCR. Representative time course data (C) and aggregate data (D) are shown. n = 4 per group. *P < 0.05; NS, not significant. Unpaired t test. (E) Disease-free control CSF lysates (top, labeled “N” for non-lymphoma) and 11 cancer patients (middle and bottom, labeled “P” for patients) were probed with the SOD3 and Albumin antibodies. See Tables S1 and S2 for detailed sample information. (F) Schematic overview of the CSF collection times within the treatment regimen of 11 CNS lymphoma patients. Timeline is plotted on the X axis and number of weeks between events are indicated. (G) Metabolite profiling of CSF samples from patient groups as in (F). PLSDA loading plot (top) with associated features driving group separation by indicated component (bottom) are shown. Data was log-transformed and Pareto-scaled. (H) Relative levels of indicated metabolites per patient sample groups. Only significant differences are indicated. *P < 0.05, **P < 0.01. Data represent mean ± SEM.
