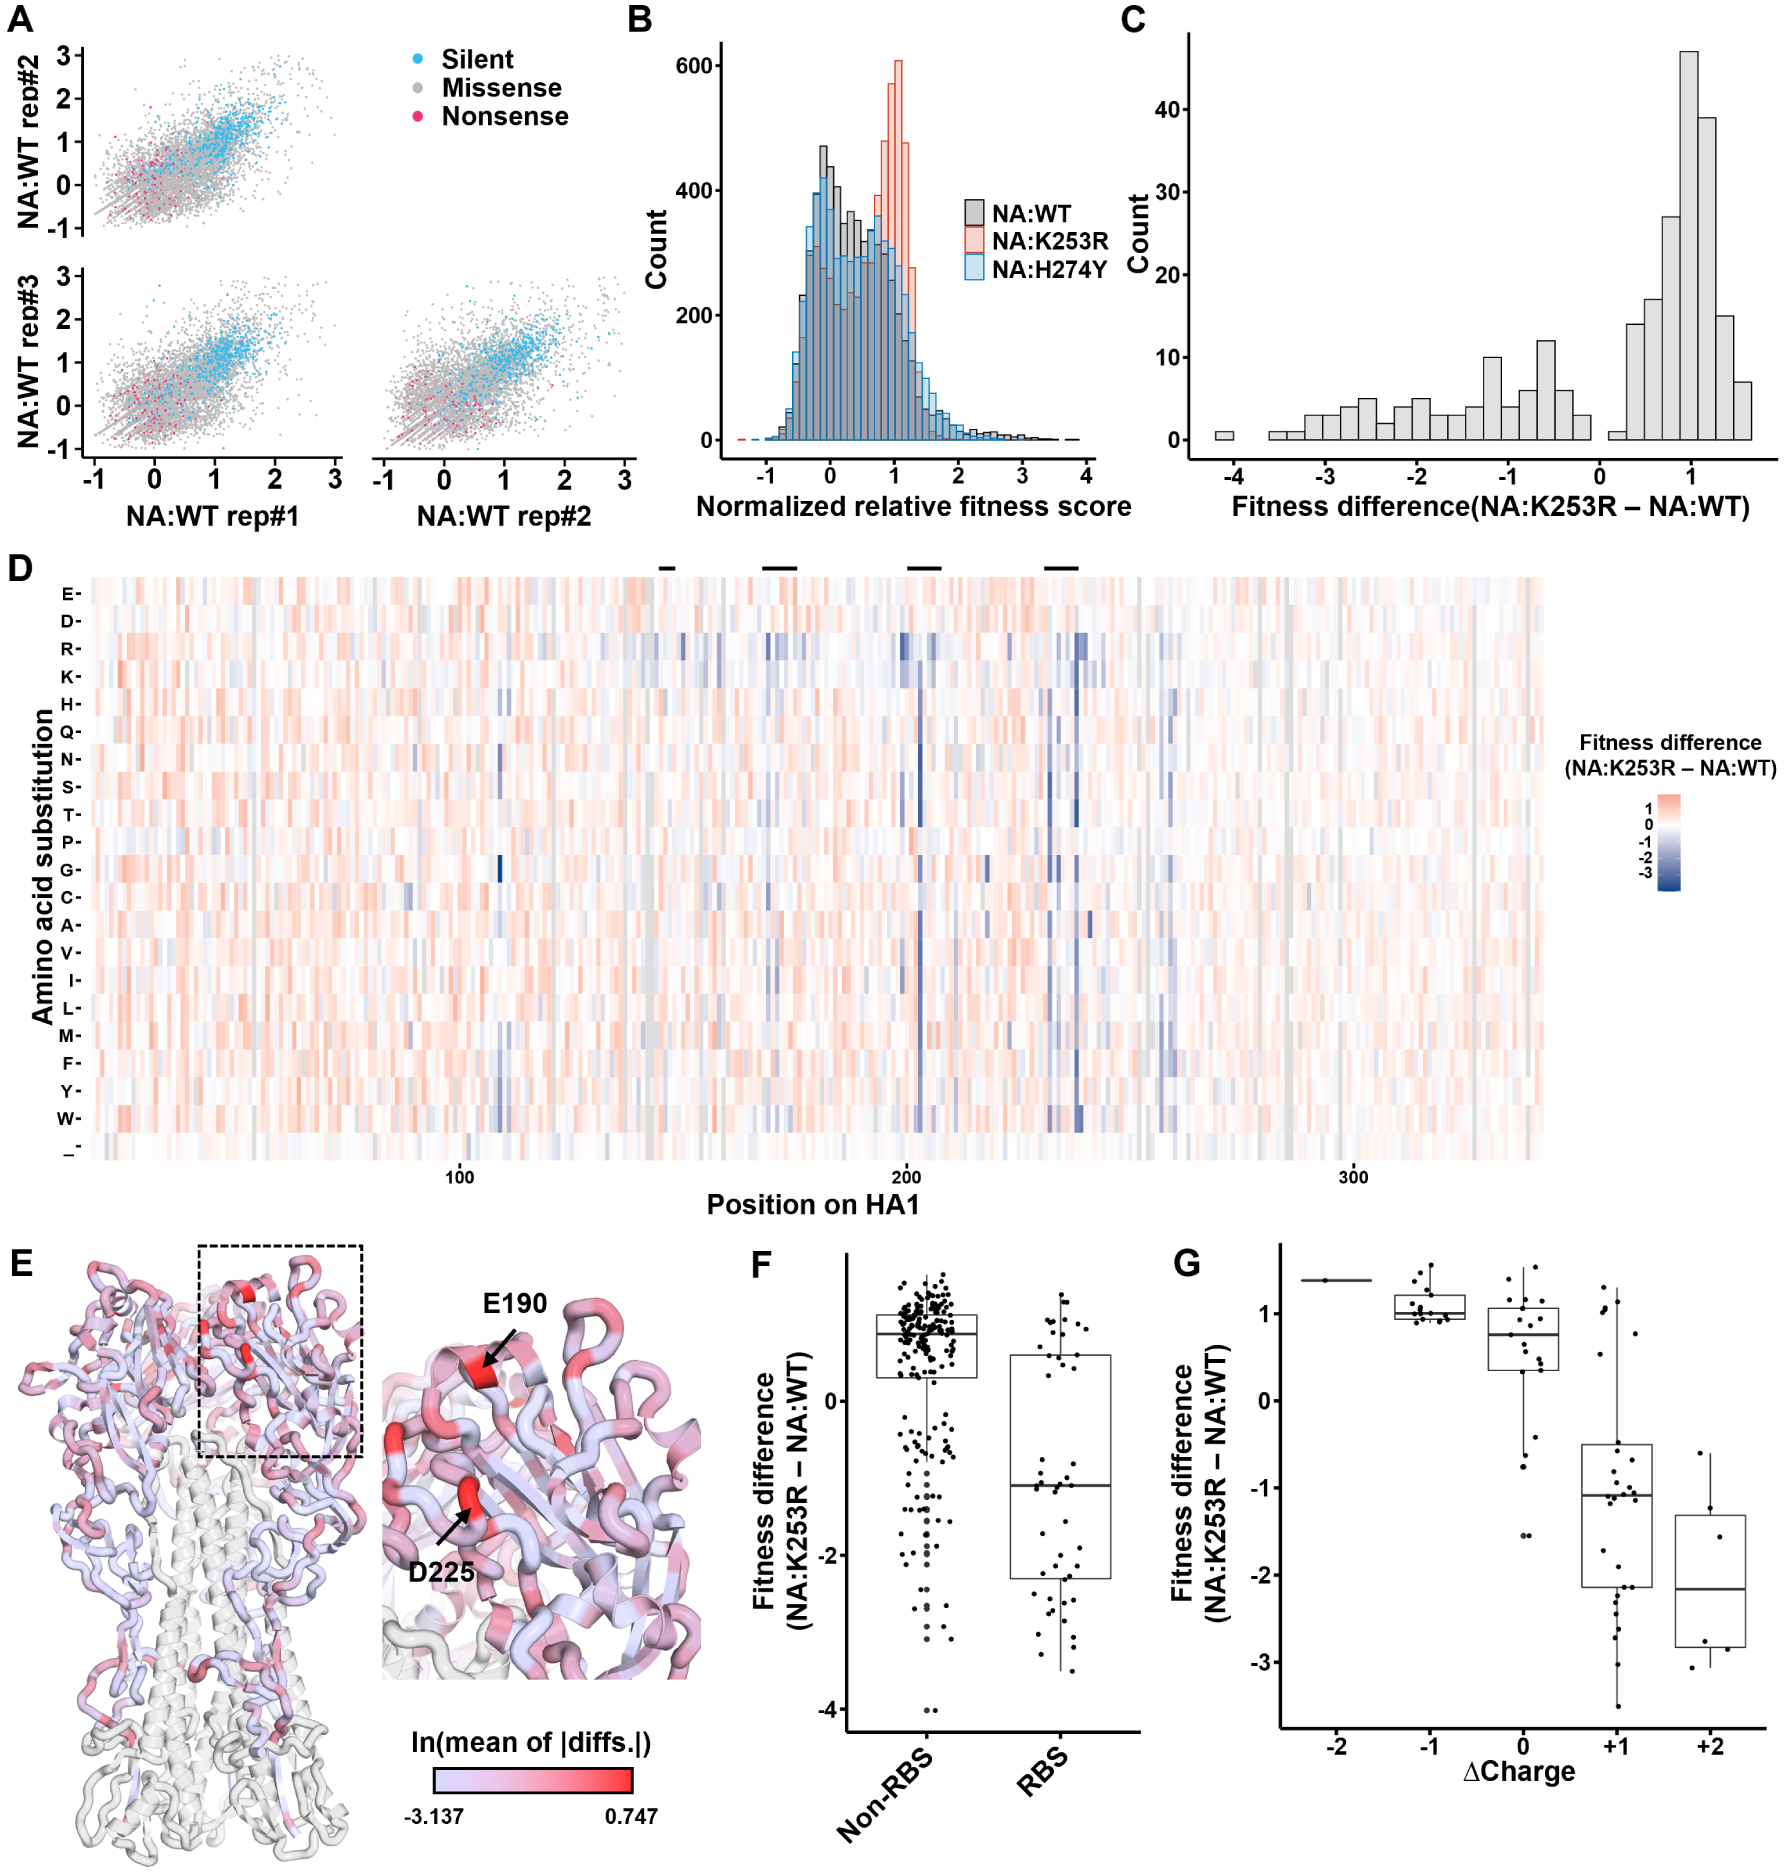
Figure 1. Phenotypic variation in NA reshapes the HA fitness landscape:

(A) Correlations of normalized relative fitness scores across NA:WT replicate populations. Each dot represents the normalized relative fitness score of a specific substitution in the two indicated samples. Silent, missense, and nonsense substitutions are colored as indicated in the legend. (B) The distributions of normalized relative fitness scores of all missense substitutions in the indicated genetic backgrounds. Values are averaged across three replicates for each genotype. (C) The distribution of differences in missense substitution fitness scores between NA:K253R and NA:WT. Only shows substitutions for which t test on differences between genotypes yielded p < 0.01. (D) Normalized relative fitness score differences between NA:WT and NA:K253R for each substitution at each residue in HA1 as measured through DMS. Each value was generated by subtracting the mean fitness score of 3 replicates for each genotype. Gray indicates that the mutation had insufficient coverage in the plasmid library. Residue numbering based on the initiating methionine. Secondary structures forming the receptor binding site (130 loop, 150 loop, 190 helix, 220 loop) are indicated by the black bars above. (E) HA structure (PDB:1RU7) showing all HA1 residues colored by the natural log values of per-residue mean of absolute differences (MAD) of all substitutions between NA:WT and NA:K253R. HA2 domain colored in white. (F) Normalized relative fitness score differences between residues in HA1 associated with the receptor binding site versus those that are not (only showing substitutions with p < 0.01 by t test for comparison between NA:WT and NA:K253R). (G) Correlation between normalized relative fitness score differences and charge changes on surface (only showing substitutions with p < 0.01 by t test for comparison between NA:WT and NA:K253R).
