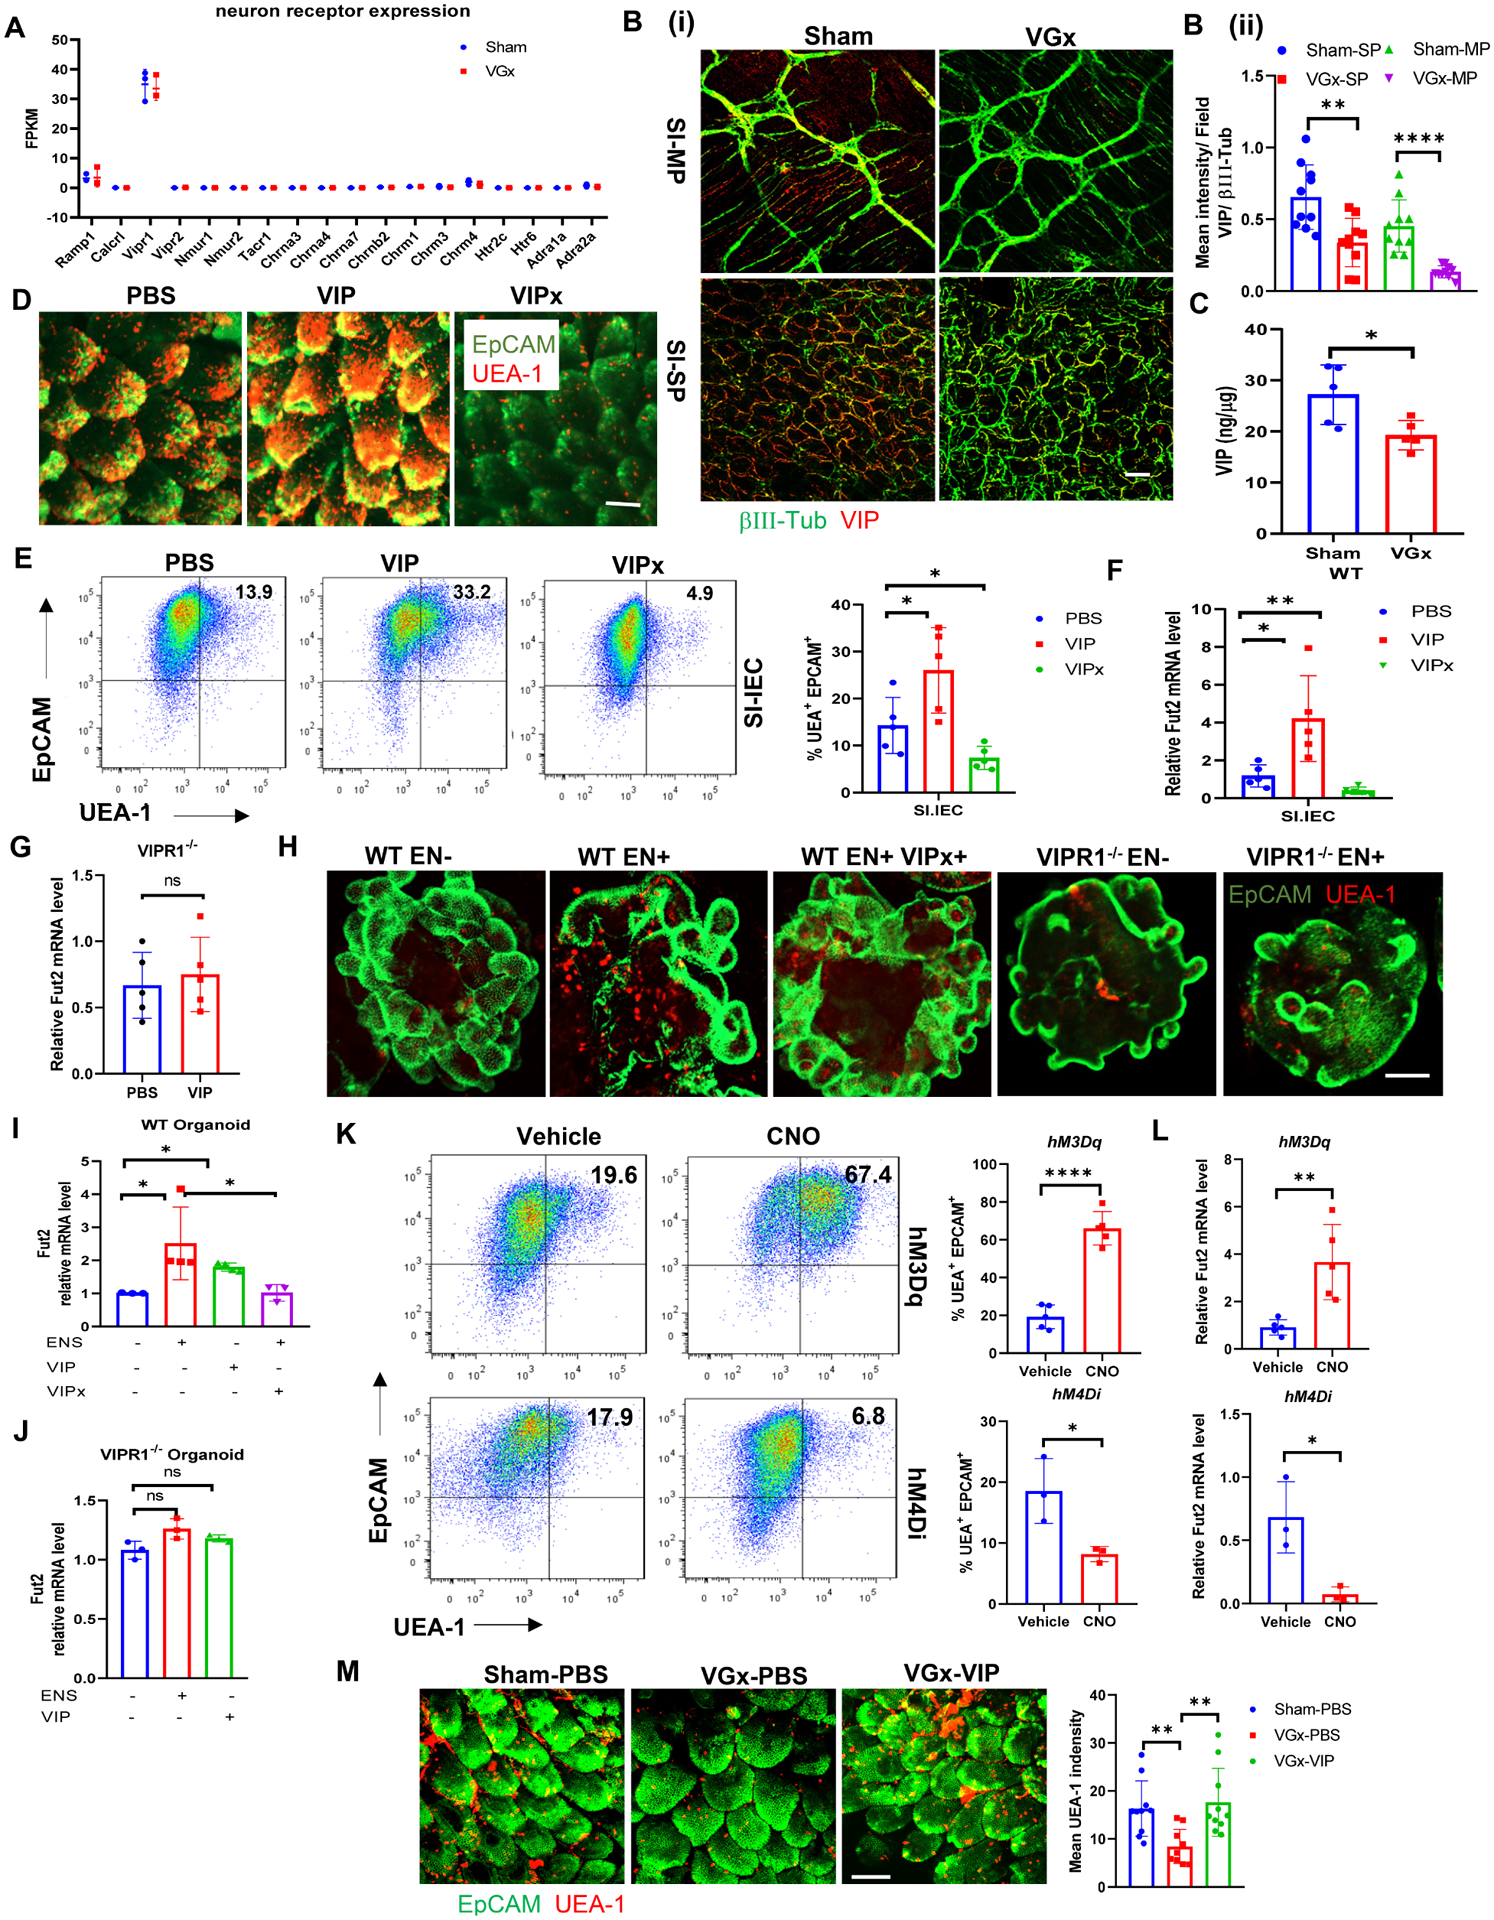
Figure 2. Enteric VIPergic neuron regulates epithelial fucosylation.

(A) The expression of genes encoding neurotransmitter and neuropeptide receptors in isolated IECs, as determined by RNA-sequencing analysis in Figure1. FPKM, Fragments Per Kilobase of transcript per Million mapped reads.
(B) Whole mount microscopy of βIII-tubulin (green) and VIP (red) staining (i) and quantification (ii) in the myenteric (MP) and submucosal plexus (SP) of ileum in Sham mice or VGx mice. Scale bar, 50 μm. ***p < 0.001.
(C) Concentration of VIP in the ileum of Sham mice or VGx mice by EIA. n = 5, representative of (B-C) 2 independent experiments. Mean ± SEM; *p < 0.05.
(D) Whole mount microscopy of EpCAM and UEA-1 staining of ileum in WT mice 12 h after injection with PBS, VIP (6 μg/mice) or VIPx (100 μg/mice). Data are representative of at least 5 mice per condition. Scale bar, 50 μm.
(E) Representative plots of FACS and summary graphs of the percentage of UEA-1 stained IECs of ileum in WT mice 12 h after injection with PBS, VIP or VIPx.
(F-G) Real-time PCR analysis of Fut2 mRNA expression in IECs of ileum in WT (F) or VIPR1−/− mice (G) 12 h after injection with PBS, VIP or VIPx.
Data (D-G) were shown as Mean ± SEM; n = 5, representative of 3 independent experiments. *p < 0.05. **p < 0.01, ns not significant.
(H-J) UEA-1 staining of intestinal organoid cultures (H), scale bar, 50 μM; and real-time PCR analysis of Fut2 expression in intestinal organoid cultures from WT mice (I) or from VIPR1−/− (J). Representative of 2 or more fields in 3 independent cultures. Mean ± SEM; n = 5, *p < 0.05, ns: not significant.
(K) Representative plots of FACS and summary graphs of the percentage of UEA-1 stained colonic IECs from VipIRES-crehM3Dqfl/+ mice or VipIRES-crehM4Difl/fl after treatment with vehicle or CNO.
(L) Real-time PCR analysis of Fut2 expression in colonic IECs from VipIRES-crehM3Dqfl/+ mice or VipIRES-crehM4Di-fl/fl after treatment with vehicle or CNO. n = 3–5. (L-M) Representative of 2 independent experiments. Mean ± SEM; * p < 0.05, **p < 0.01. ****p < 0.0001, ns: not significant.
(M) Whole mount microscopy of EpCAM and UEA-1 staining of ileum in sham mice or VGx mice after repeated injection with PBS or VIP (6 μg/mice). Scale bar, 50 μm.
See also Figures S2 and S3.
