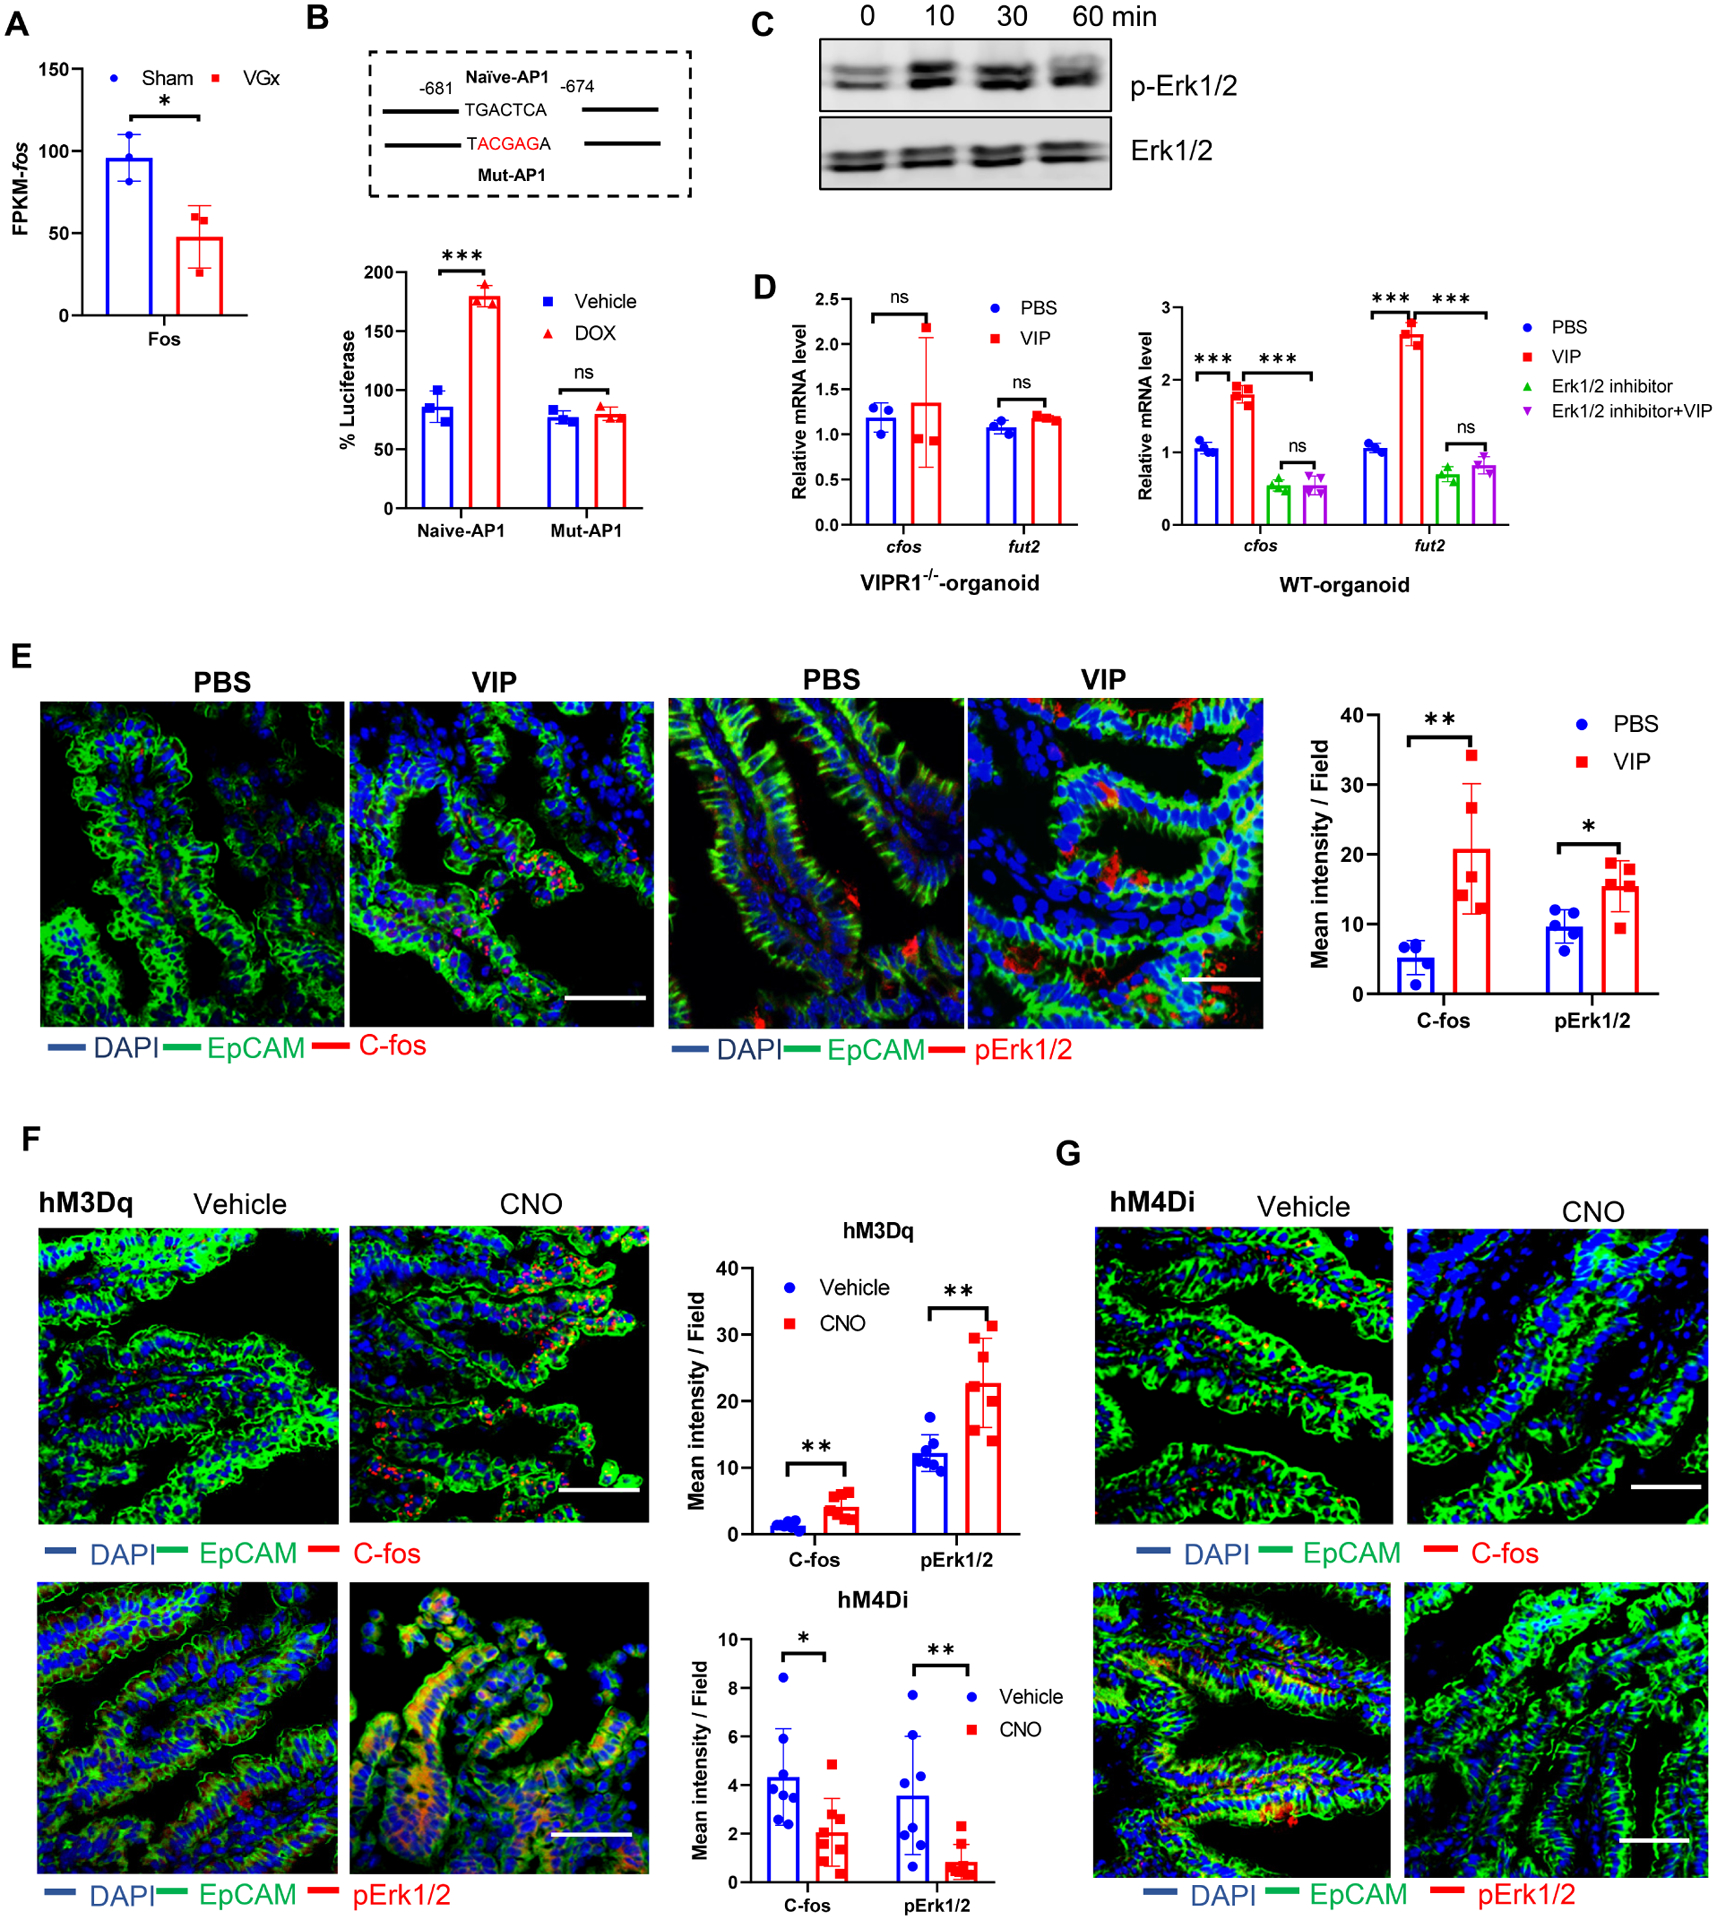
Figure 3. VIP activates Fut2 expression via Erk/c-Fos pathway.

(A) The expression of c-fos in isolated IECs, as determined by RNA-sequencing analysis as Figure 1.
(B) Fut2 promoter activity as demonstrated with luciferase activity. Naïve-AP1 represents fut2 promoter with naïve AP-1 binding site and Mut-AP1 represents fut2 promoter with mutated AP-1 binding site as indicated in the figure. The number indicates the position AP-1 site with the start of first exon set as +1. Data were shown as relative luciferase activity with the ratio of Dox:vehicle. Mean ± SEM, ***p < 0.001, ns not significant.
(C) Representative western blot image of p-Erk1/2 in ileal IECs stimulated with VIP (100 nM) for the indicated time.
(D) C-fos mRNA and Fut2 expression in intestinal organoid cultures from WT mice or from VIPR1−/− stimulated with/without VIP in the presence or absence of Erk1/2 inhibitor (FR180204, 50 μM) for 12 h. (B-D) Data are representative of three independent experiments.
(E) Immunofluorescence section and quantification for C-fos (red) or p-Erk1/2 (red) with EpCAM (green) and DAPI staining of ileum in WT mice 12h after injection with PBS or VIP (6 μg/mice).
(F-G) Immunofluorescence section and quantification for C-fos (red) or p-Erk1/2 (red) with EpCAM (green) and DAPI staining of ileum in VipIRES-crehM3Dqfl/+ mice (F, activating DREADD) or VipIRES-crehM4Difl/fl mice (G, inhibitory DREADD) after treatment with vehicle or CNO. (E-G) Data are representative of at least 5 mice per condition. Scale bar, 50 μm. * p < 0.05, **p < 0.01.
