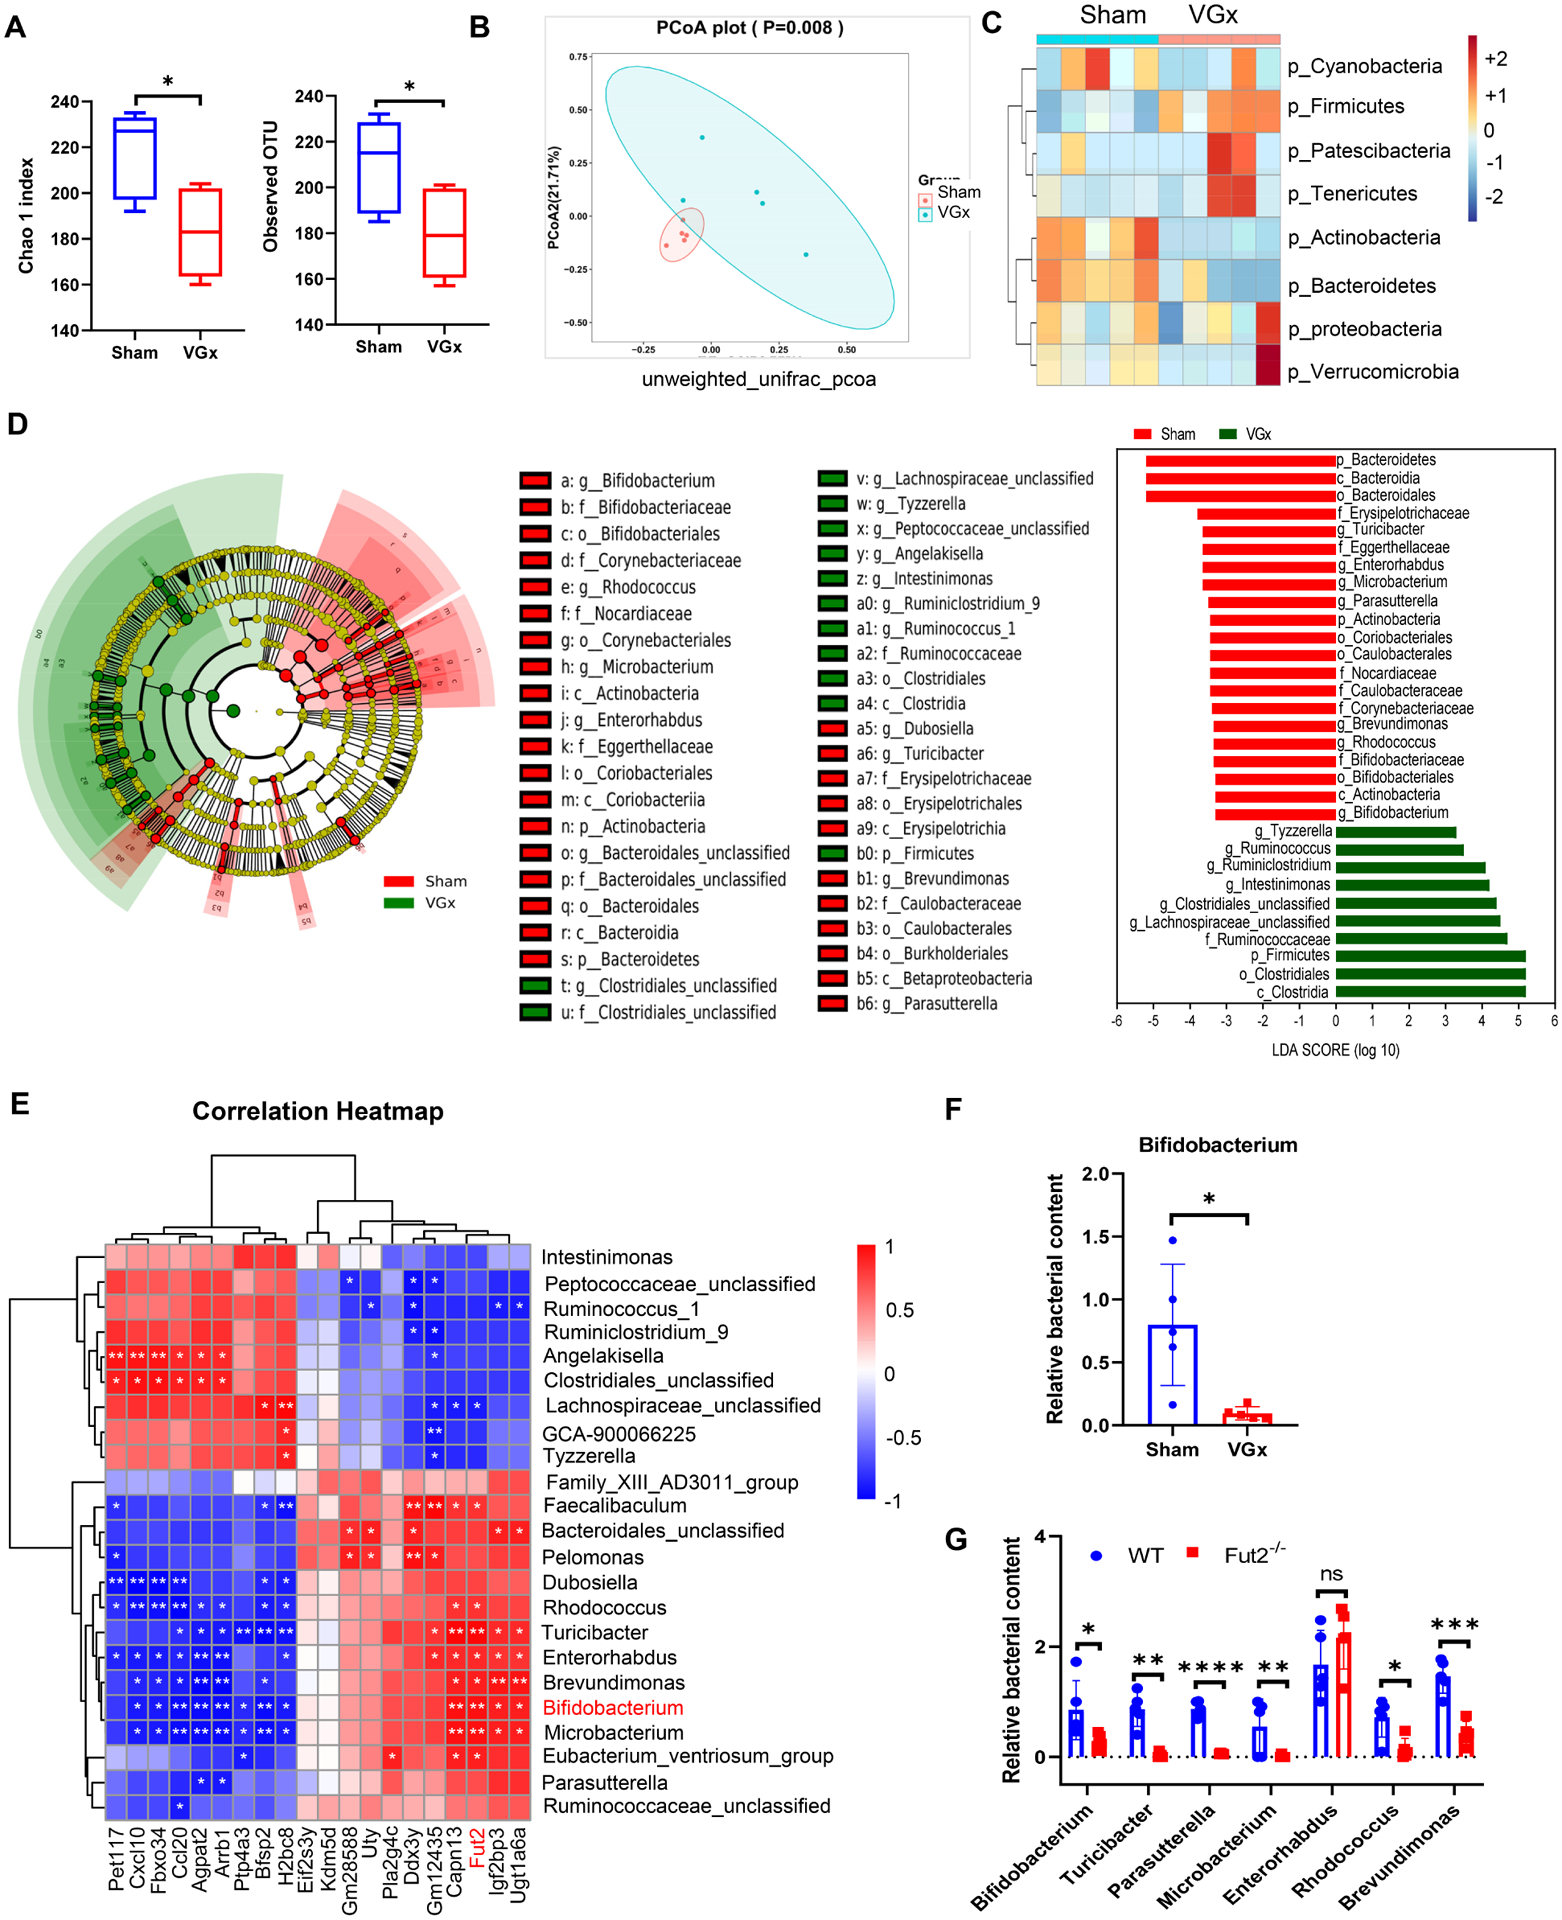
Figure 4. Denervation attenuates Bifidobacterium abundance that correlates with the level of fucosylation.

(A) Alpha diversity represented by the Chao1 and observed OTU index.
(B) Principal coordinates analysis (PCoA) of unweighted UniFrac distance based on 16S rRNA sequencing of fecal samples from Sham mice and VGx mice. Ellipse represents 95% confidence of sampling. n = 5, p = 0.008.
(C) Heatmap showing the clustering of the two groups based on log-relative abundances of filtered microbiota at the phylum levels.
(D) Results of a linear discriminant analysis of microbiota composition in VGx mice compared to Sham mice are displayed as a cladogram (left), highlighting differences in the abundance of taxa (red and green highlighting) determined by 16S rRNA gene amplicon sequencing. Taxa are arranged on a circular phylogenetic tree. Green, taxa elevated in VGx mice compared to Sham mice; Red, taxa reduced in VGx mice compared to Sham mice.
LDA scores (right) of the differentially abundant taxa. Taxa enriched in microbiota from Sham mice (red) are indicated with a negative LDA score related to that from VGx mice (green) (Kruskal-Qallis test, p<0.05 and LDA >=±3); n = 5.
(E) Spearman correlation analyses between the abundance of gut bacteria at the genus levels (Top 23 most differentiated) and the level of IEC genes expression (Top 20 most differentiated). R values (value of coefficient) are shown in different colors as indicated in the figure, the red color represents a positive correlation, the blue color represents a negative correlation.
(F) Real-time PCR analysis of relative abundance of Bifidobacterium.
(G) Relative abundance of bacterial genera in fecal samples from WT and Fut2−/− mice determined by real-time PCR, the most correlated genera with fu2 expression levels were chosen for realtime PCR analysis. (F-G) Mean ± SEM; n = 5, *p < 0.05, ** p < 0.01, ***p < 0.001, ****p < 0.0001.
See also Figure S4.
