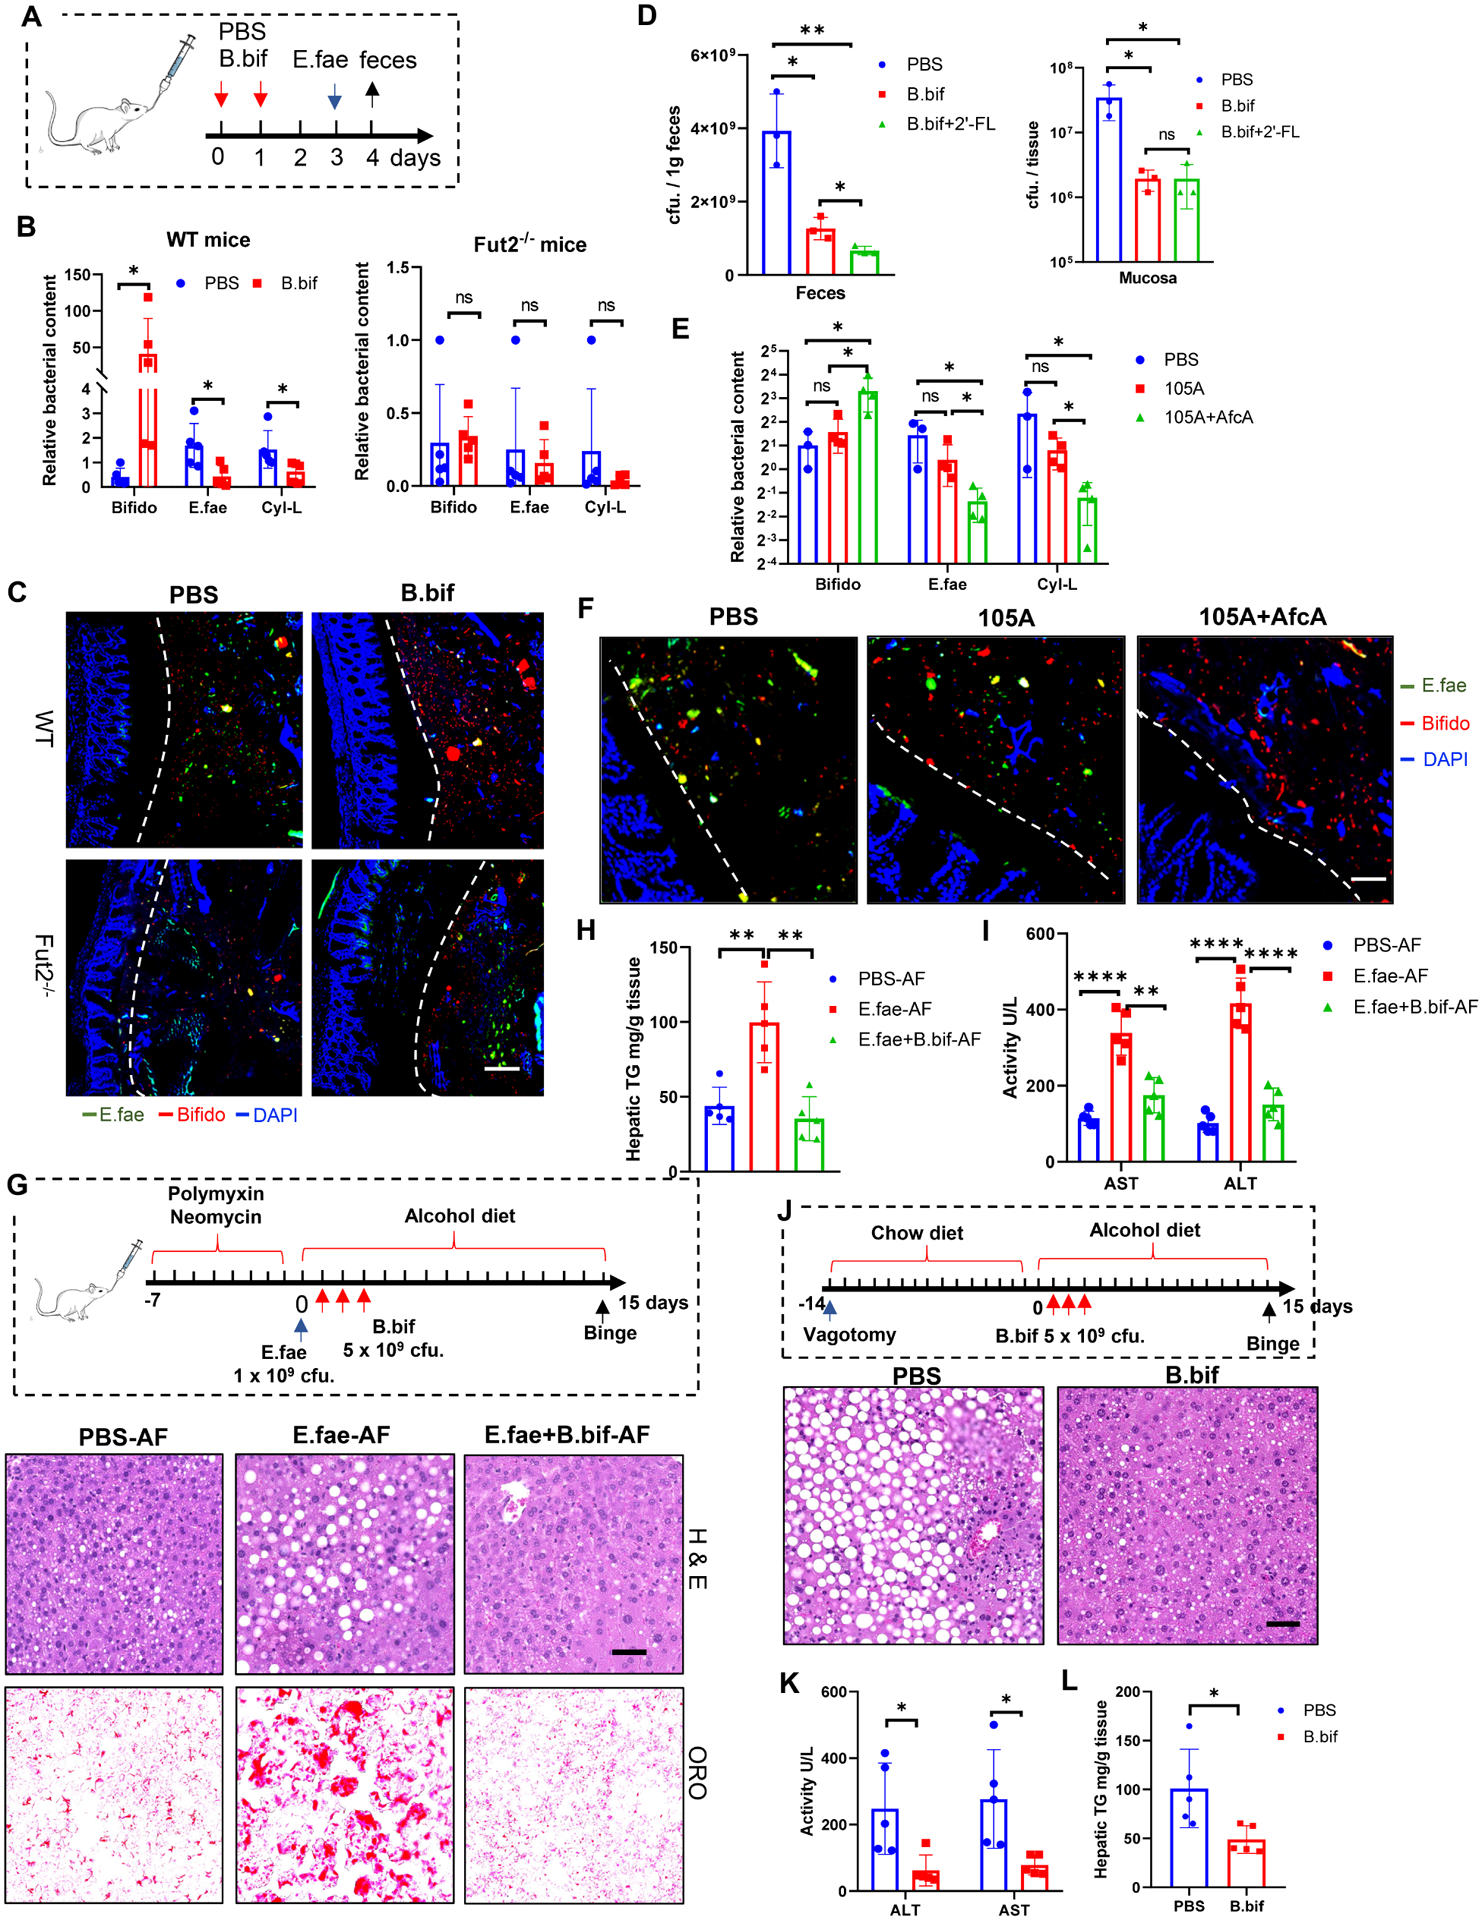
Figure 7. Fucosidase-producing Bifidobacteria inhibit E. faecalis intestinal colonization and ameliorate ALD.

(A-C) Co-colonization of B. bifidum (B. bif) and E. faecalis (E. fae) in both SPF WT and Fut2−/− mice. Schematic diagram of the co-colonization experiment (A), Total Bifidobacterium and E. faecalis in the lumen and mucus layer were assessed by RT-PCR (B) and FISH analysis (C) using a probe targeted to the 16S rRNA of Bifidobacterium (red) and E. faecalis (green). Scale bar, 50 μm.
(D) Co-colonization of B. bifidum (B. bif) and E. faecalis in germ free (GF) mice. E. faecalis CFU in the feces and mucosa was assessed by plating at day 3 of colonization of E. faecalis. 2’-FL (2 mg/kg/day) was given to GF mice by gavage.
(E-F) Co-colonization of B. longum 105A strains and E. faecalis in SPF mice. Total Bifidobacterium (Bifido) and E. faecalis in the feces (E) and mucus layer (F) were assessed by RT-PCR (E) and FISH analysis (F) using a probe targeted to the 16S rRNA of Bifidobacterium (red) and E. faecalis (green). Scale bar, 50 μm.
(G-I) Administration of B. bifidum ameliorated E. faecalis-mediated liver disease in the ALD model. Schematic diagram and H&E staining and Oil red O staining of liver (G); Serum ALT and AST levels (H); liver triglyceride quantification (I). Scale bar, 50 μm.
(J-L) Administration of B. bifidum reverse vagotomy-increased liver damage in the ALD model. H&E staining and Oil red O staining of liver (J); Serum ALT and AST (K); Hepatic triglycerides (L). Data represent (A-C) 3, (D) 2, (E-F) 3, (G-L) 2 independent experiments combined. Scale bar, 50 μm. n=5, mean ± SEM. *p < 0.05, **p < 0.01, ***p < 0.001, ****p < 0.0001.
