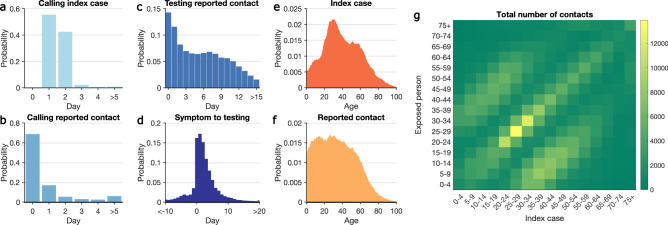
Fig. 1. Key statistics of contact tracing in NYC.
a–d The distributions of: a time between reporting date for index cases and being called by contact tracers; b time between calling index cases and notifying exposed persons; c time between notifying exposed persons and specimen sampling of notified individuals who were tested; d time from symptom onset to specimen sampling for symptomatic COVID infections. A negative value implies that testing preceded symptom onset. Age distributions of index cases (e) and self-reported contacts (f). The contact mixing matrix (g) shows the total number of exposures among age groups reported during the study period.

