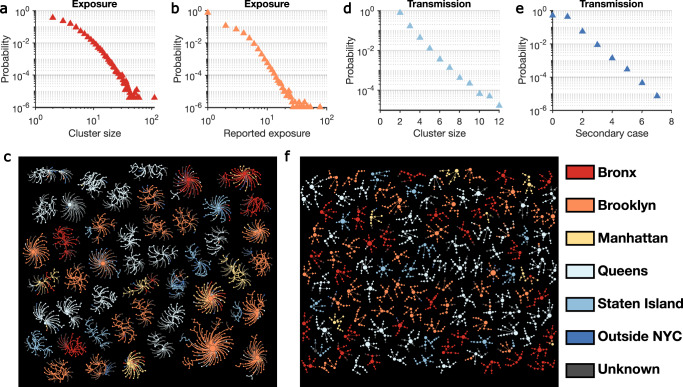
Fig. 2. Structure of exposure and transmission networks.
a, b The distributions of cluster size and number of close contacts reported by each index case in the exposure network. Exposure clusters with more than 35 individuals are visualized in (c). The exposure network is undirected. Index cases and reported close contacts are connected. Node size is proportional to the number of connected individuals. Colors indicate the home location of each person (five boroughs in NYC, outside NYC, and unknown). The distributions of cluster size and the number of secondary cases in the transmission network are shown in (d) and (e), respectively. f Visualizes transmission clusters with more than six infected individuals. Node size represents the number of secondary cases. Arrows indicate the direction of transmission.

