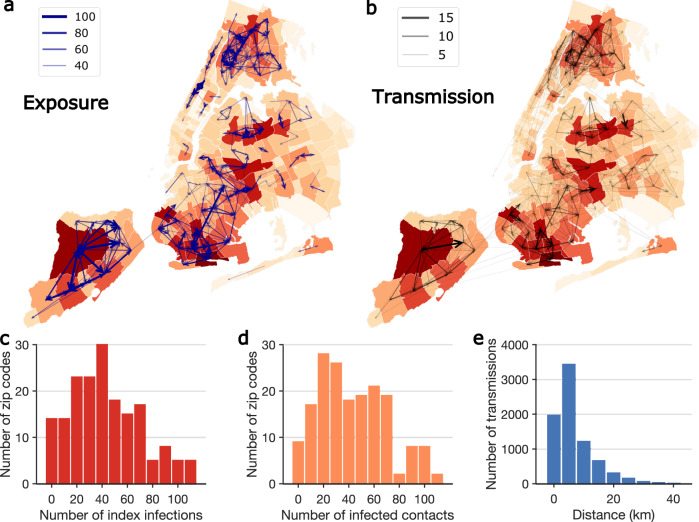
Fig. 3. Spatial transmission of SARS-CoV-2 in NYC.
a, b The exposures and transmission events across ZIP codes in NYC identified from contact tracing data. Arrows indicate direction of exposure (from index cases to reported close contacts) and transmission (from index infections to infected contacts). Arrow thickness indicates the number of exposures and transmission events. ZIP code area color represents the cumulative number of confirmed cases during the study period (yellow to red—low to high). To better visualize, exposure links with less than 30 events and transmission links with <2 events are not shown on the maps. For cross-ZIP code transmission events, the distributions of index infections and infected contacts across ZIP code areas are presented in c and d. e The distribution of distance between home ZIP codes of index infections and infected contacts in cross-ZIP code transmission events. The population weighted centroids for ZIP code areas were used to compute the distance.

