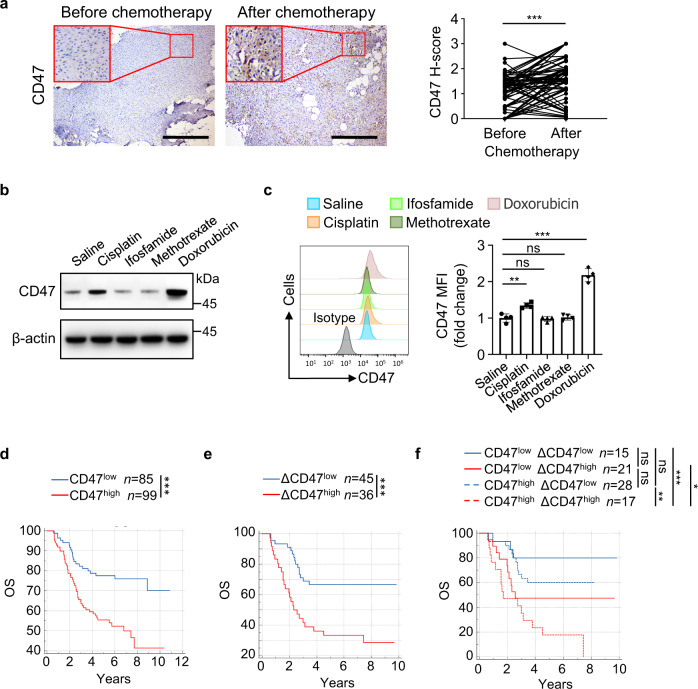
Fig. 1. Osteosarcoma chemotherapy induces CD47 upregulation, which is associated with poor prognosis for patients.
a Immunohistochemistry analysis of CD47 expression (CD47 H-score) in matched osteosarcoma specimens from the same patient before and after chemotherapy (n = 81 patients). Scale bar, 400 μm. b, c Cisplatin or doxorubicin was injected intravenously every 2 days, and ifosfamide or methotrexate was injected intravenously every 4 days, after GFP+ HOS tumor grew for 14 days. b Western blot analysis of CD47 expression in HOS tumors on day 22. c Flow cytometric analysis of CD47 protein expression in GFP+ HOS cells from tumors on day 22 (left; n = 4 mice per group). The anti-CD47 median fluorescence intensity (MFI) was determined (right). d Kaplan–Meier curves of overall survival (OS) of osteosarcoma patients stratified by CD47 expression in pre-chemotherapy specimens. High CD47 expression (CD47high): CD47 H-score > 0.9; low CD47 expression (CD47low): CD47 H-score ≤ 0.9. e, f ΔCD47 H-score for each patient was obtained from subtracting CD47 H-score of pre-chemotherapy specimen from that of paired post-chemotherapy specimen. e Kaplan–Meier curves of overall survival (OS) of osteosarcoma patients stratified by ΔCD47 expression. High ΔCD47 expression (ΔCD47high): ΔCD47 H-score > 0.8; low ΔCD47 expression (ΔCD47low): ΔCD47 H-score ≤ 0.8. f Kaplan–Meier curves of overall survival (OS) of osteosarcoma patients stratified by CD47 expression in pre-chemotherapy specimens and ΔCD47 expression. Low CD47 expression and low ΔCD47 expression (CD47low ΔCD47low): CD47 H-score ≤ 0.9 and ΔCD47 H-score ≤ 0.8; low CD47 expression and high ΔCD47 expression (CD47low ΔCD47high): CD47 H-score ≤ 0.9 and ΔCD47 H-score > 0.8; high CD47 expression and low ΔCD47 expression (CD47high ΔCD47low): CD47 H-score > 0.9 and ΔCD47 H-score ≤ 0.8; high CD47 expression and high ΔCD47 expression (CD47high ΔCD47high): CD47 H-score > 0.9 and ΔCD47 H-score > 0.8. Data are shown as the mean ± SD. ns, not significant. *P < 0.05, **P < 0.01, ***P < 0.001, paired two-tailed Student t test (a), one-way ANOVA (c) or log-rank test (d–f). The experiment was performed three times with similar results (b, c). See the Source Data file for the exact P values. Source data are provided as a Source Data file.

