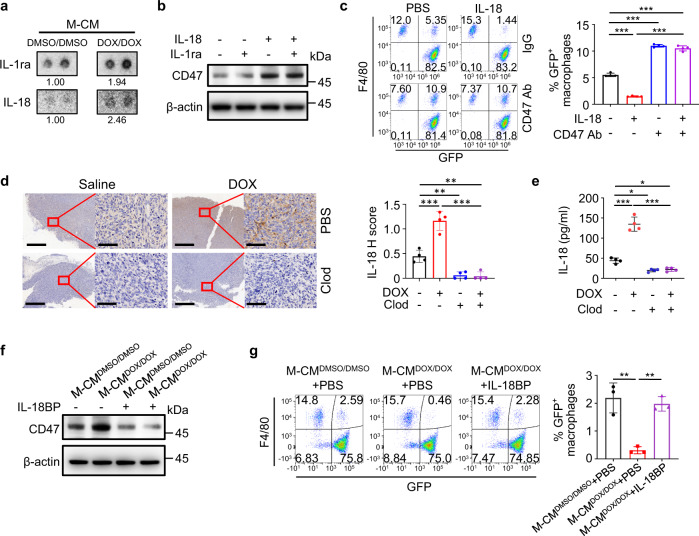
Fig. 4. Macrophage-secreted IL-18 induces CD47 expression in osteosarcoma cells.
a Analysis of cytokines in M-CMDMSO/DMSO or M-CMDOX/DOX by using a human cytokine array. Representative images for cytokines with elevated content in TAM-CMDOX/DOX are shown. Numbers indicate relative cytokine expression determined by mean spot pixel density. b Western blot analysis of CD47 protein in HOS cells serum-starved for 4 h followed by treatment with the indicated cytokines (40 ng/ml for each cytokine) for 24 h. c Flow cytometry-based in vitro macrophage-mediated phagocytosis assay of HOS cells in the presence of IgG or anti-CD47 antibody (CD47 Ab) for 4 h (n = 4 independent experiments). HOS cells were pretreated with PBS or IL-18 (40 ng/ml) for 24 h. Macrophages were defined as F4/80+ (labeled with PE) events, and tumor cells as GFP+. F4/80+, GFP+ events represented macrophages that had phagocytosed tumor cells. d Immunohistochemical analysis of IL-18 expression in serial sections of HOS tumors treated with saline or doxorubicin (DOX), in the presence of clodronate (Clod) liposome or phosphate buffer saline (PBS) liposome on day 22 (n = 4 mice per group). Scale bar, 800 μm and 80 μm, respectively. e ELISA analysis of IL-18 concentrations in homogenates of HOS tumors treated with saline or doxorubicin (DOX), with clodronate (Clod) liposome or PBS liposome on day 22 (n = 4 mice per group). f Western blot analysis of HOS cells treated with M-CMDMSO/DMSO or M-CMDOX/DOX in the presence or absence of IL-18BP (2.5 μg/ml) for 24 h. g Flow cytometry-based in vitro macrophage phagocytosis assay. HOS cells were treated with M-CMDMSO/DMSO, M-CMDOX/DOX, or a combination of M-CMDOX/DOX and IL-18BP for 24 h (n = 3 independent experiments). Macrophages were defined as F4/80+ (labeled with PE) events, and tumor cells as GFP+ events. F4/80+, GFP+ events represented macrophages that had phagocytosed tumor cells. Data are shown as the mean ± SD. *P < 0.05, **P < 0.01, ***P < 0.001, one-way ANOVA (c–e, g). The experiment was performed three times with similar results (a, b, d–f). See the Source Data file for the exact P values. Source data are provided as a Source Data file.

