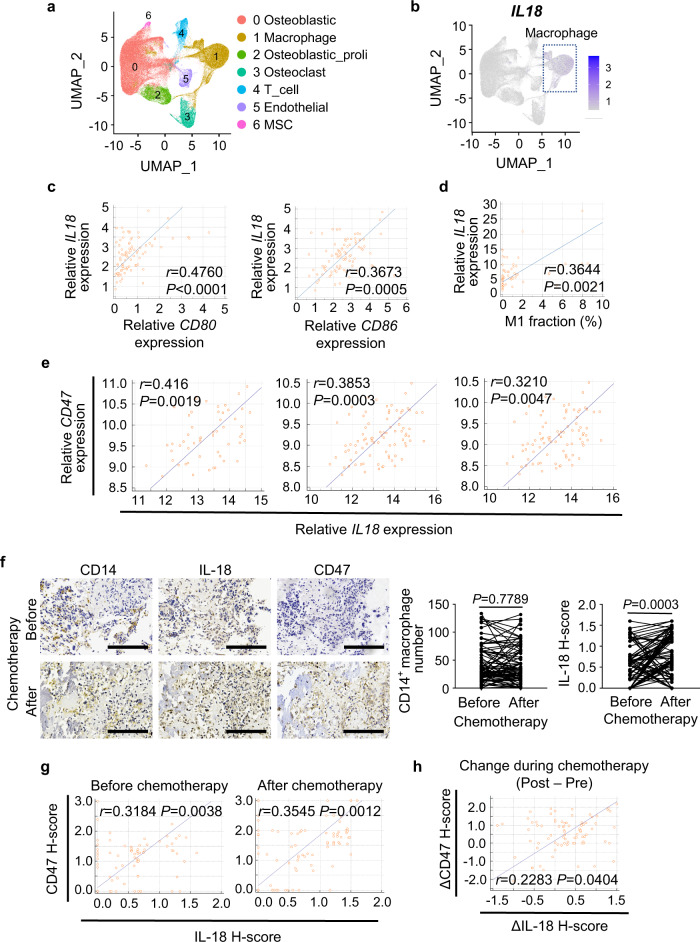
Fig. 6. IL-18 expression positively correlates with CD47 expression in osteosarcoma patients.
a Uniform Manifold Approximation and Projection (UMAP) plot showing clusters of seven main cell types (n = 11 osteosarcoma samples of patients). MSC, mesenchymal stem cell. b UMAP plot showing expression profiles of the IL18 gene (n = 11 osteosarcoma samples of patients). c Scatter plots showing the correlation between IL18 and M1 macrophage marker (CD80 and CD86) gene expression in osteosarcoma patients from TARGET (n = 86 patients). Log2 (TPM + 1) values were used for calculation and visualization. d Scatter plots showing the correlation between IL18 gene expression and M1 macrophage fraction of immune cells in osteosarcoma patients from TARGET (n = 69 patients). M1 macrophage fraction was calculated by CIBERSORT. e Scatter plots showing the correlation between IL18 and CD47 gene expression in osteosarcoma patients from GSE21257 (left; n = 53 patients), GSE33382 (middle; n = 84 patients), and GSE30699 (right; n = 76 patients). f Representative immunohistochemical images showing CD14, IL-18, and CD47 expression in pre- and post-chemotherapy specimens from the same patient. Scale bar, 200 μm. Comparative analyses of immunohistochemistry-based quantification of CD14 and IL-18 expression are shown on the right. 81 pairs of matched specimens were analyzed (n = 81 patients). g Scatter plots showing the correlation between IL-18 and CD47 expression in osteosarcoma specimens before (left) or after (right) chemotherapy. h Scatter plots showing the correlation between changes of IL-18 and CD47 expression during chemotherapy. ΔIL-18/ΔCD47 H-score for each patient was obtained from subtracting IL-18/CD47 H-score of pre-chemotherapy specimen from that of paired post-chemotherapy specimen. Data are shown as the mean ± SD. Pearson correlation test (c–e, g, h) or paired two-tailed Student t test (f). Source data are provided as a Source Data file.

