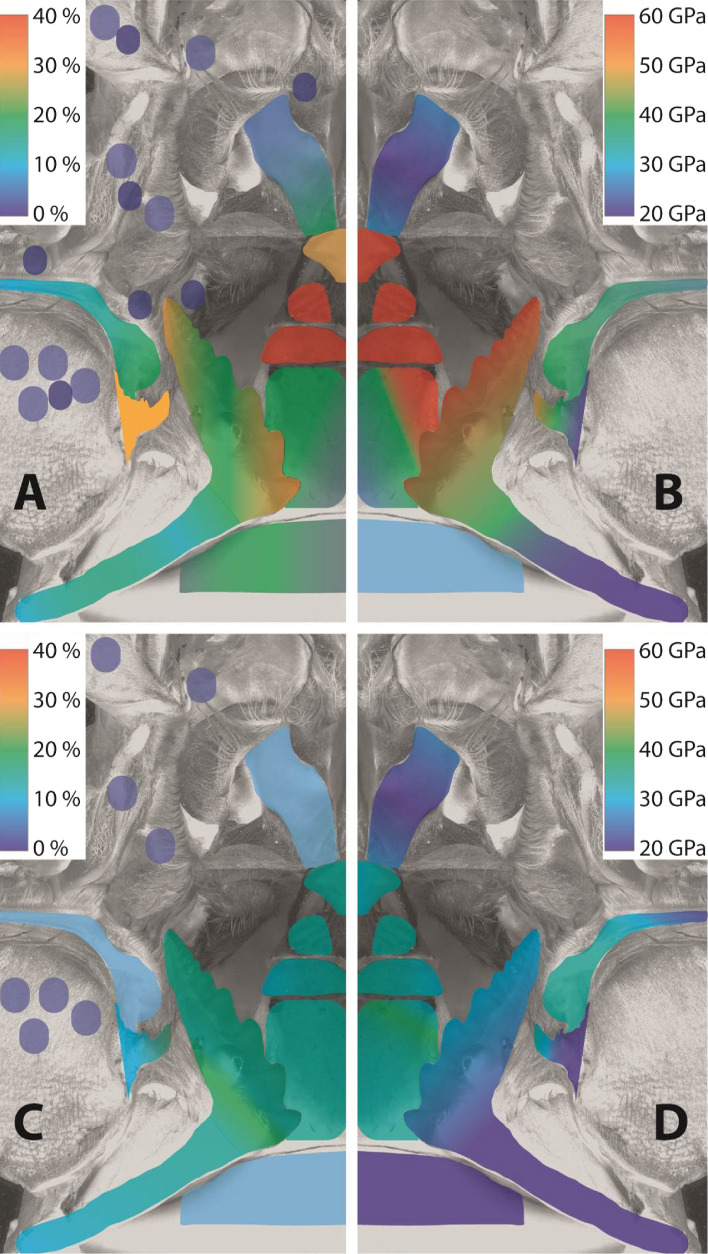
Figure 6.
Left side: distribution of all elements (Ae), which are not the basis of chitin, in the epicuticle (above) and the exocuticle (below). Right side: Young’s modulus of the epicuticle (above) and the exocuticle (below). For the material property gradients, we used the mean values of the tested localities, rounded them to either 0%, 10%, 20%, 30%, and 40% for the elemental composition and to 20 GPa, 30 GPa, 40 GPa, 50 GPa, and 60 GPa for the Young’s modulus. The smallest value (0% and 20 GPa) was assigned to the color dark blue and the highest value (40% and 60 GPa) to red. These colors were then assigned to the localities tested by creating areas in illustrator, which were colored employing the illustrator gradient tool.

