Figure 8.

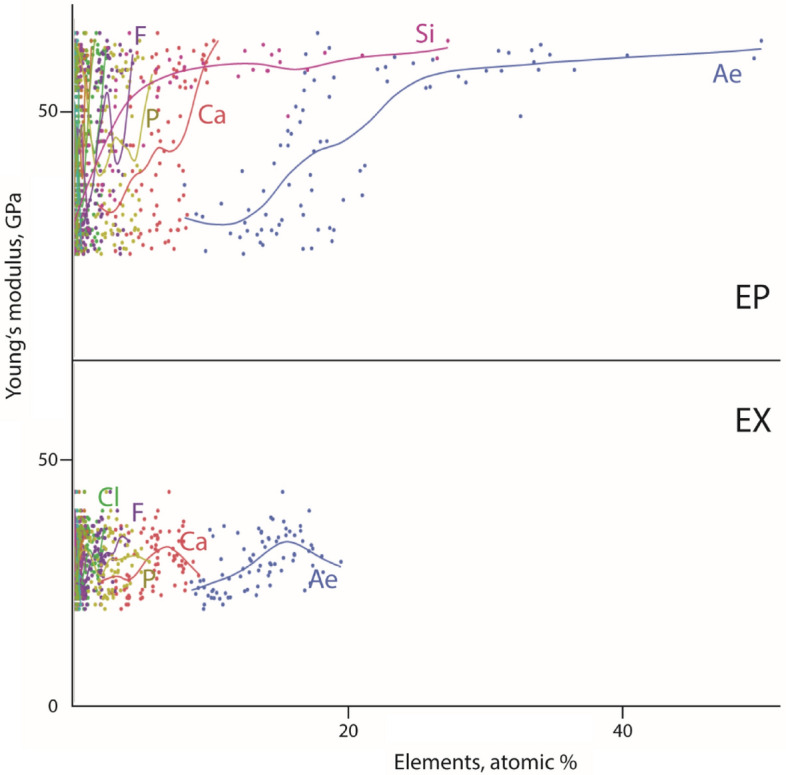
Relationship between the Young’s modulus, given in GPa, and the proportions, given in atomic %, of each individual element and Ae for the epicuticle (above) and the exocuticle (below). Ae all elements, EP epicuticle, EX exocuticle.

Relationship between the Young’s modulus, given in GPa, and the proportions, given in atomic %, of each individual element and Ae for the epicuticle (above) and the exocuticle (below). Ae all elements, EP epicuticle, EX exocuticle.