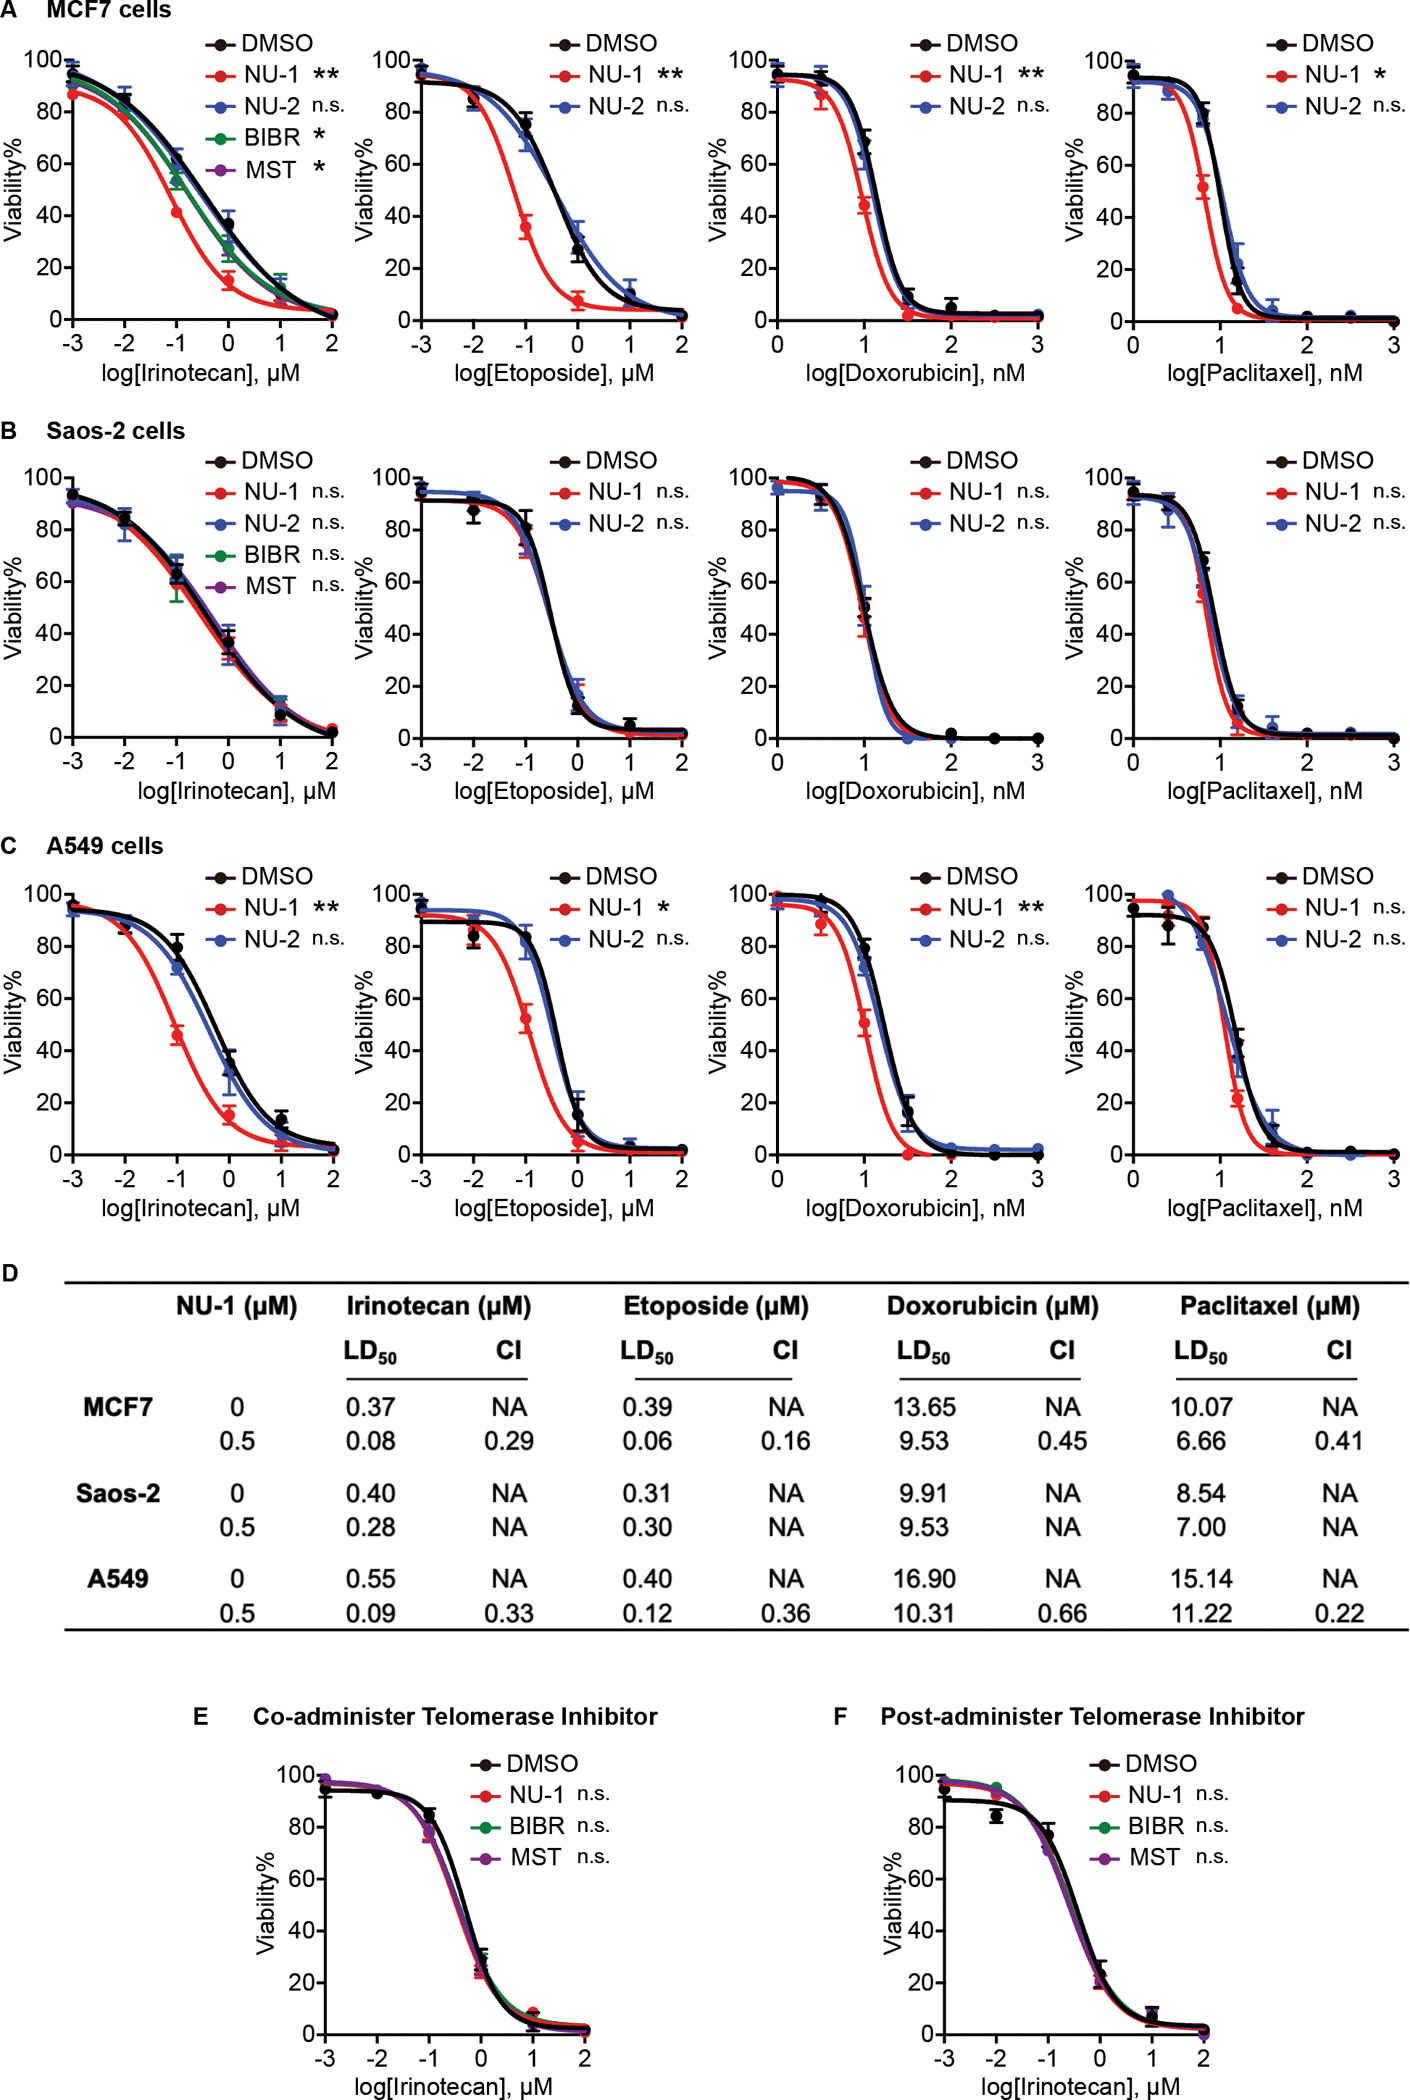
Figure 2. TERT inhibition sensitizes telomerase-positive cells to chemotherapy.

(A-C) Dose-response curves indicating the viability of MCF7 cells (A), ALT Saos-2 cells (B), and A549 cells (C) pretreated for 4 h with DMSO, NU-1 (0.5 μM), or NU-2 (0.5 μM), BIBR 1532 (BIBR, 10 μM), MST-312 (MST, 1 μM), then for 24 h with indicated concentration of irinotecan, etoposide, paclitaxel, or doxorubicin, and cell viability determined.
(D) Lethal Dose 50 (LD50) in cells and Combination Index (CI) were calculated from data from A-C. CI<1, synergistic; CI=1, addictive; CI>1, antagonistic.
(E) Viability of MCF7 cells where DMSO or telomerase inhibitors were co-administered with irinotecan for 24 h.
(F) Viability of MCF7 cells treated with irinotecan for 4 h before adding DMSO or telomerase inhibitors for 24 h.
Data obtained from three replicates, mean ± SEM. LD50 were used for statistical analysis, ** 0.001< P < 0.01, * 0.01< P < 0.05, n.s. P > 0.05 compared to DMSO (unpaired t-test).
