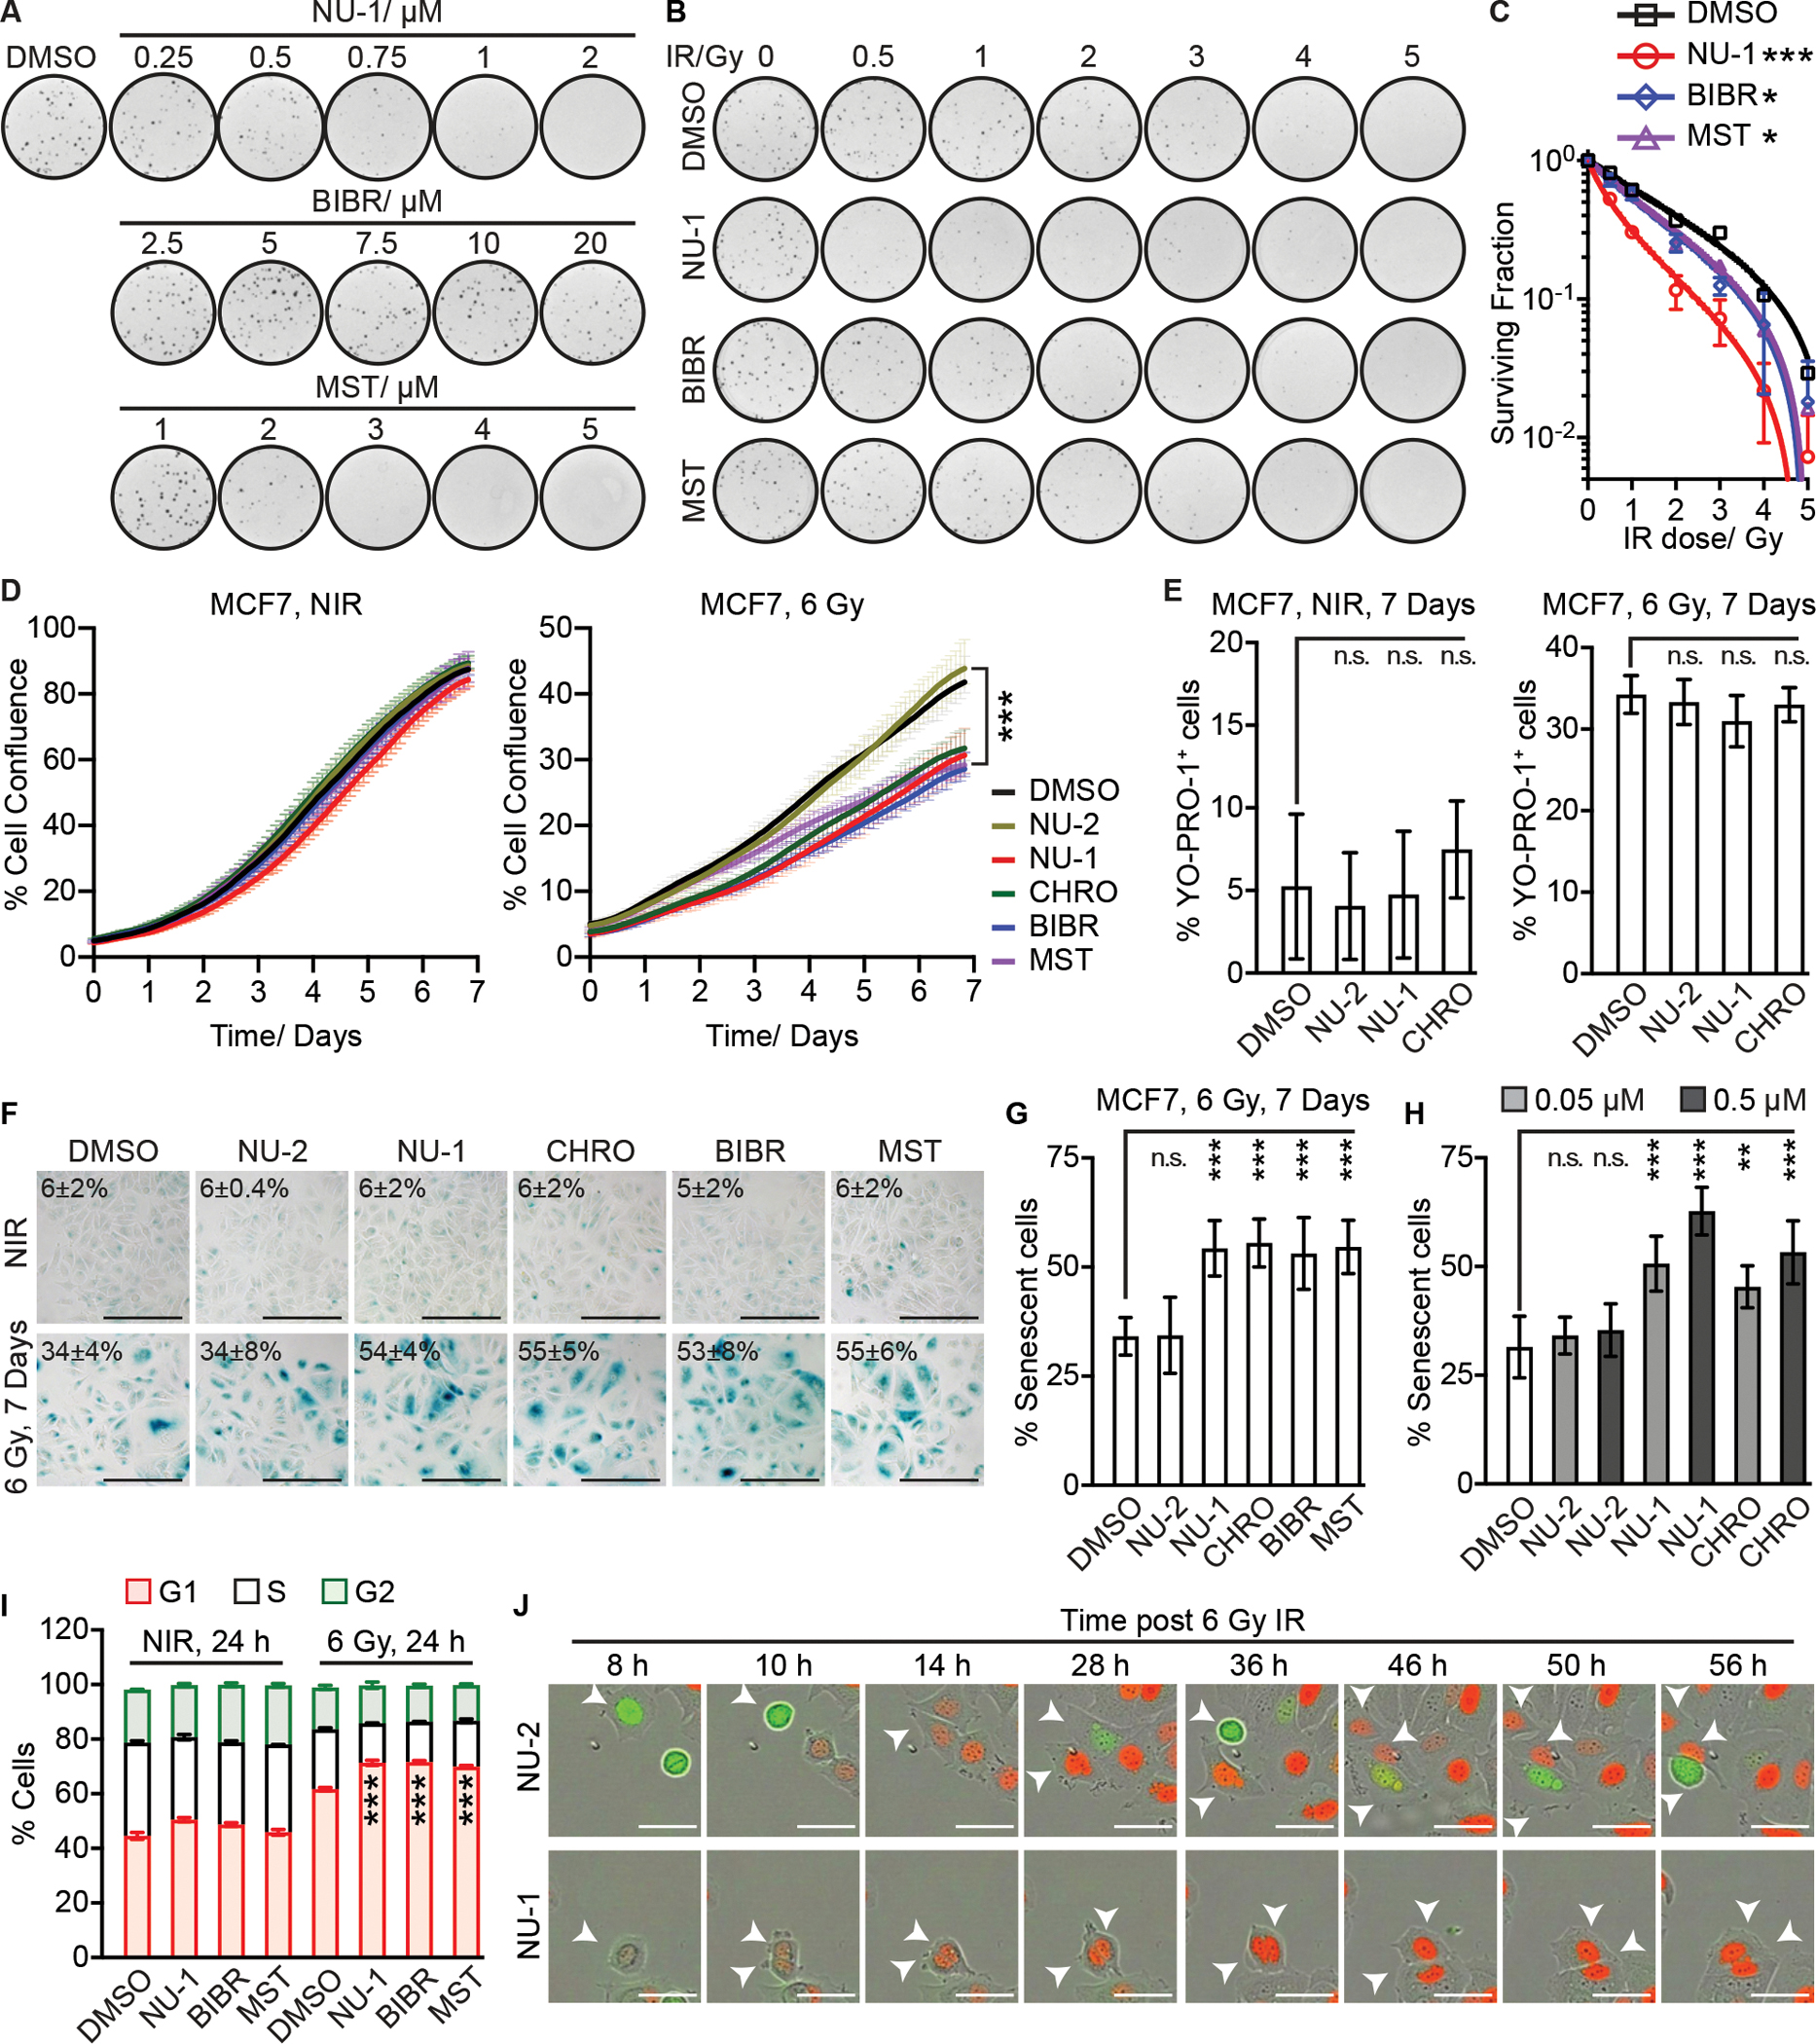
Figure 3. TERT inhibition induces radiosensitivity and cellular senescence.

(A) Clonogenic assay of MCF7 cells treated with DMSO control, NU-1, BIBR (BIBR 1532), or MST (MST-312) at indicated concentrations.
(B) Clonogenic survival of MCF7 cells irradiated at indicated doses ± DMSO, NU-1 (0.5 μM), BIBR (10 μM), or MST (1 μM). Representative images from triplicates.
(C) Normalized surviving fractions of cells in B, mean ± SD.
(D) Proliferation analysis over 6 days comparing MCF7 cells treated with TERT inhibitors or controls for 1 h before 0 (left, NIR) or 6 Gy (right) at time 0, mean ± SEM.
(E) Quantification of YO-PRO-1+ cells. Cells were treated with indicated compounds ± IR, followed by staining after 7 days, mean ± SD.
(F) SA-β-Gal staining of MCF7 cells treated as in D, after 7 days. Representative 20X images. Scale bars=200 μm.
(G) Quantification of SA-β-Gal+ cells in F, mean ± SD.
(H) % SA-β-Gal+ MCF7 cells. Cells were treated as indicated for 1 h, followed by IR and staining after 7 days, mean ± SD.
(I) MCF7 cells were treated with indicated compounds ± 6 Gy IR, followed by cell cycle analysis after 24 h. Data from three replicates, mean ± SD.
(J) MCF7-FUCCI cells were treated with NU-1 or NU-2 for 1 h before 6 Gy at time 0 h. Successive representative images are shown. Red, G1 phase. Green, S/G2. Arrows indicate the tracked mother and daughter cells. Scale bars=50 μm. *** P <0.001; ** 0.001< P < 0.01, n.s. P > 0.05 compared to DMSO (unpaired t-test).
