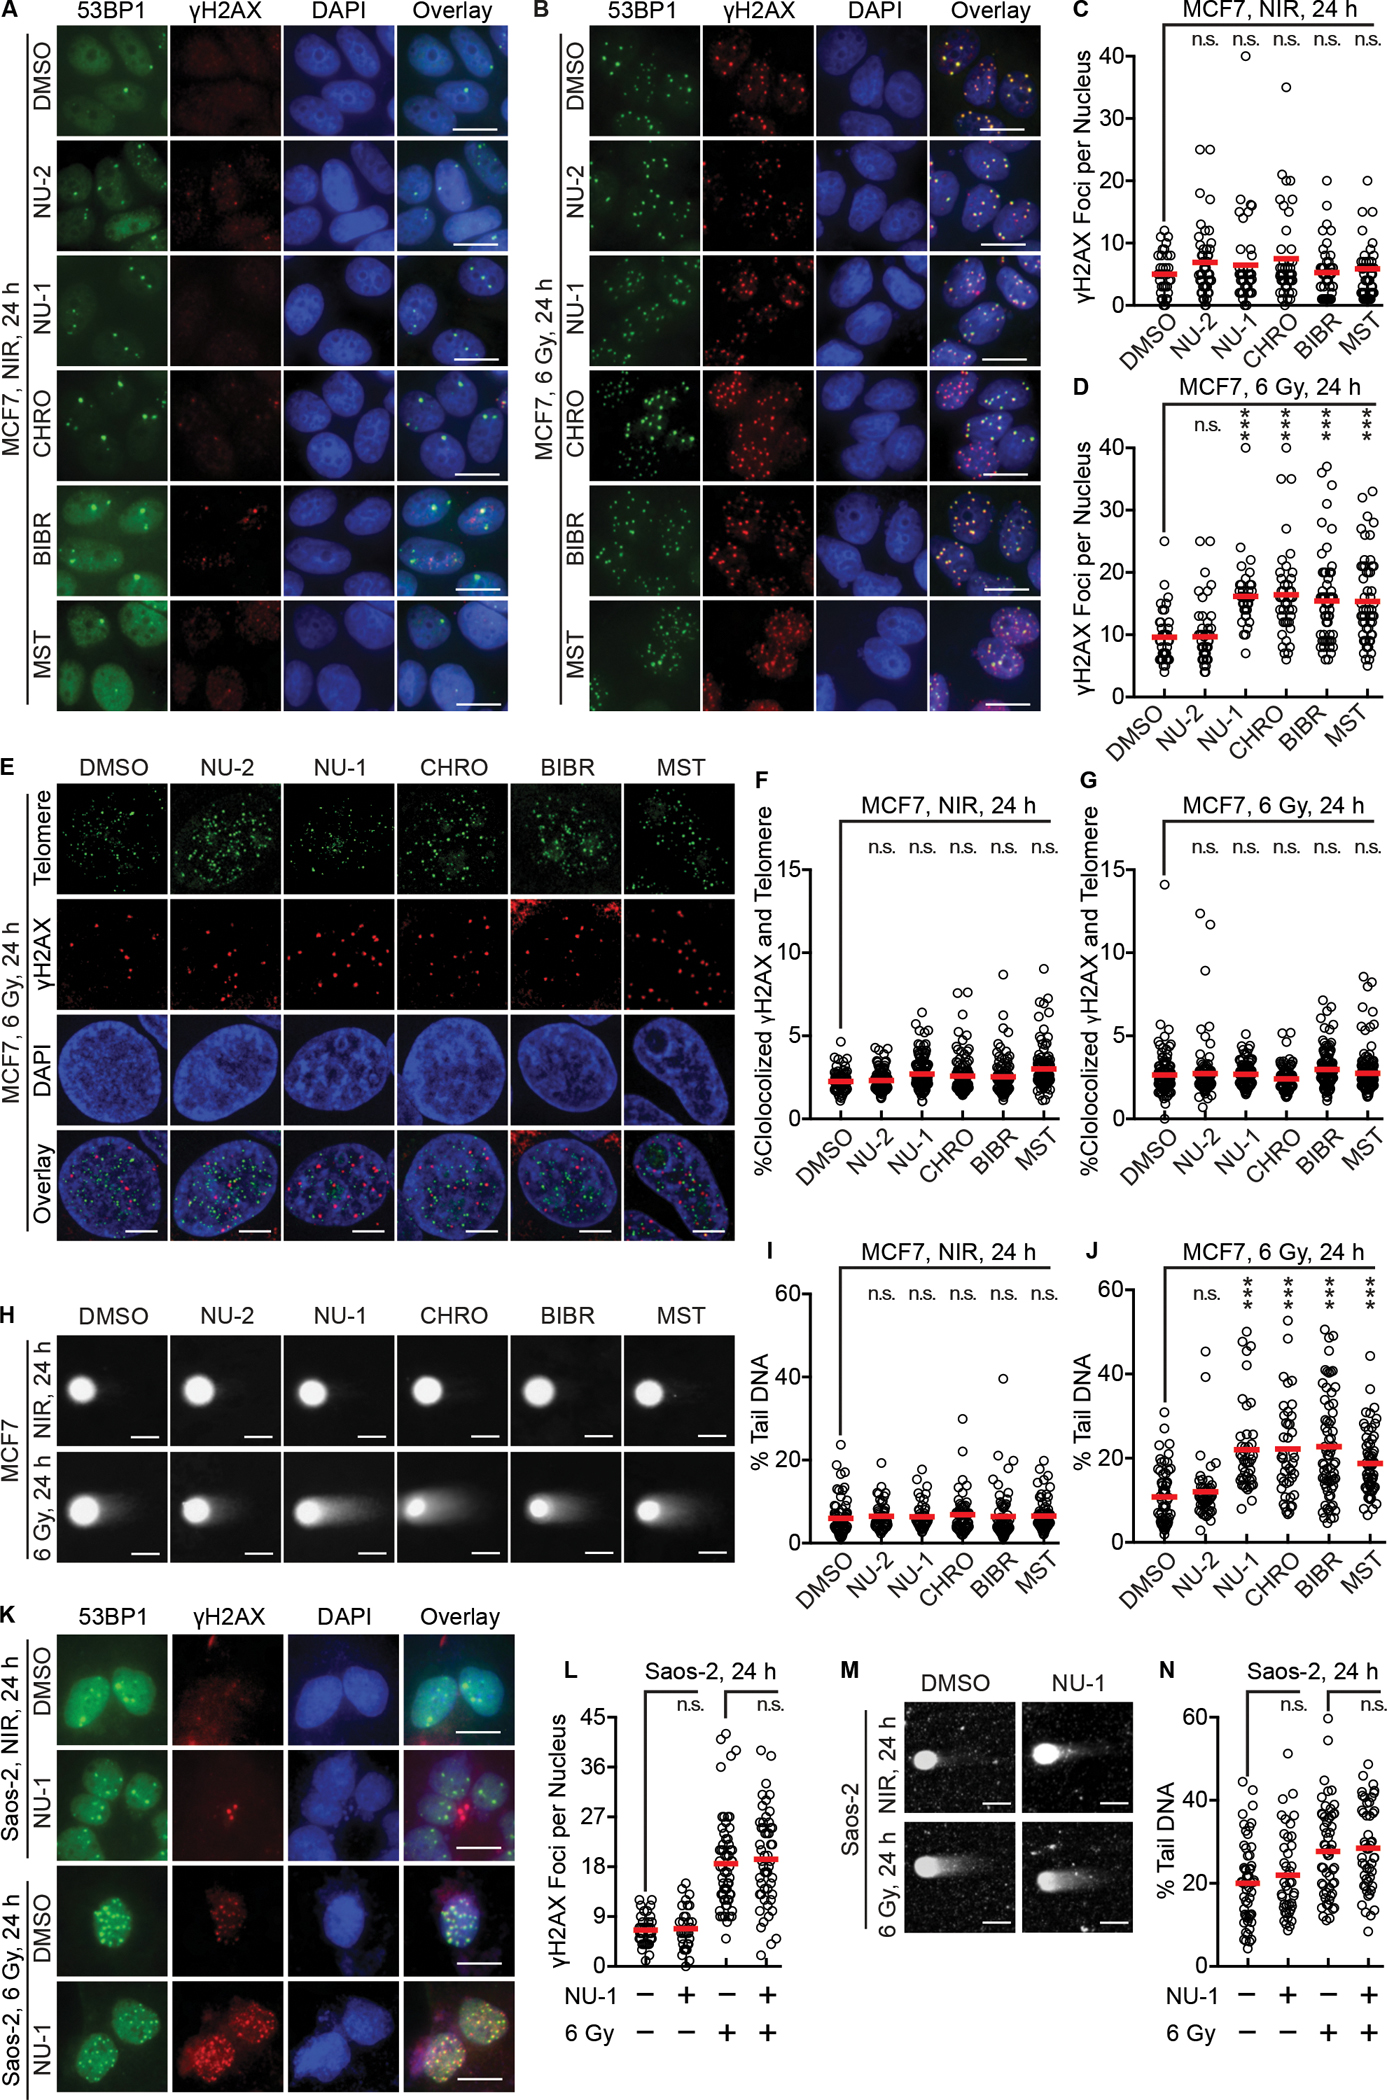
Figure 4. TERT inhibition induces persistent DNA damage foci and delays double-strand break repair after irradiation in telomerase positive cells.

(A and B) Representative pseudo-colored images of staining for DNA damage foci markers 53BP1 (green) or γH2AX (red), DAPI (blue), and a three-color overlay. MCF7 cells were treated with DMSO, NU-2 (0.5 μM), NU-1 (0.5 μM), CHRO (0.5 μM), BIBR (10 μM), or MST (1 μM) for 1 h, followed by 0 (NIR, A) or 6 Gy (B), then fixed and stained after 24 h. Scale bars=20 μm.
(C and D) Quantification of γH2AX foci of cells in A (C) and B (D).
(E) Representative pseudo-colored staining images of cells treated as in B with 6 Gy showing telomere probe (green), γH2AX (red), DAPI (blue), and a three-color overlay. Scale bars=5 μm.
(F and G) Quantification analysis of telomere and γH2AX colocalization after 0 (F) or 6 Gy (G).
(H) Neutral comet assay of MCF7 cells treated as in A and B. Representative images demonstrate “comet tails”. Scale bars=20 μm.
(I and J) Quantification of comet assay results after 0 (I) or 6 Gy (J). % tail DNA indicates proportional of unrepaired chromosomal DSBs.
(K) ALT Saos-2 cells were treated with DMSO or NU-1 (1 μM) for 1 h, then 0 or 6 Gy, fixed and stained after 24 h. Shown are representative images. Scale bars=20 μm.
(L) Quantification of γH2AX foci of cells in K.
(M) Saos-2 cells treated as in H were examined by neutral comet assay. Representative images are shown. Scale bar=20 μm.
(N) Quantification of comet assay results in M. For quantification analysis, >50 cells were analyzed. Shown are individual cells (open circles) and mean (red bar).
*** P < 0.001; ** 0.001 < P < 0.01; n.s. P > 0.05 compared to DMSO (unpaired t-test).
See also Figure S4.
