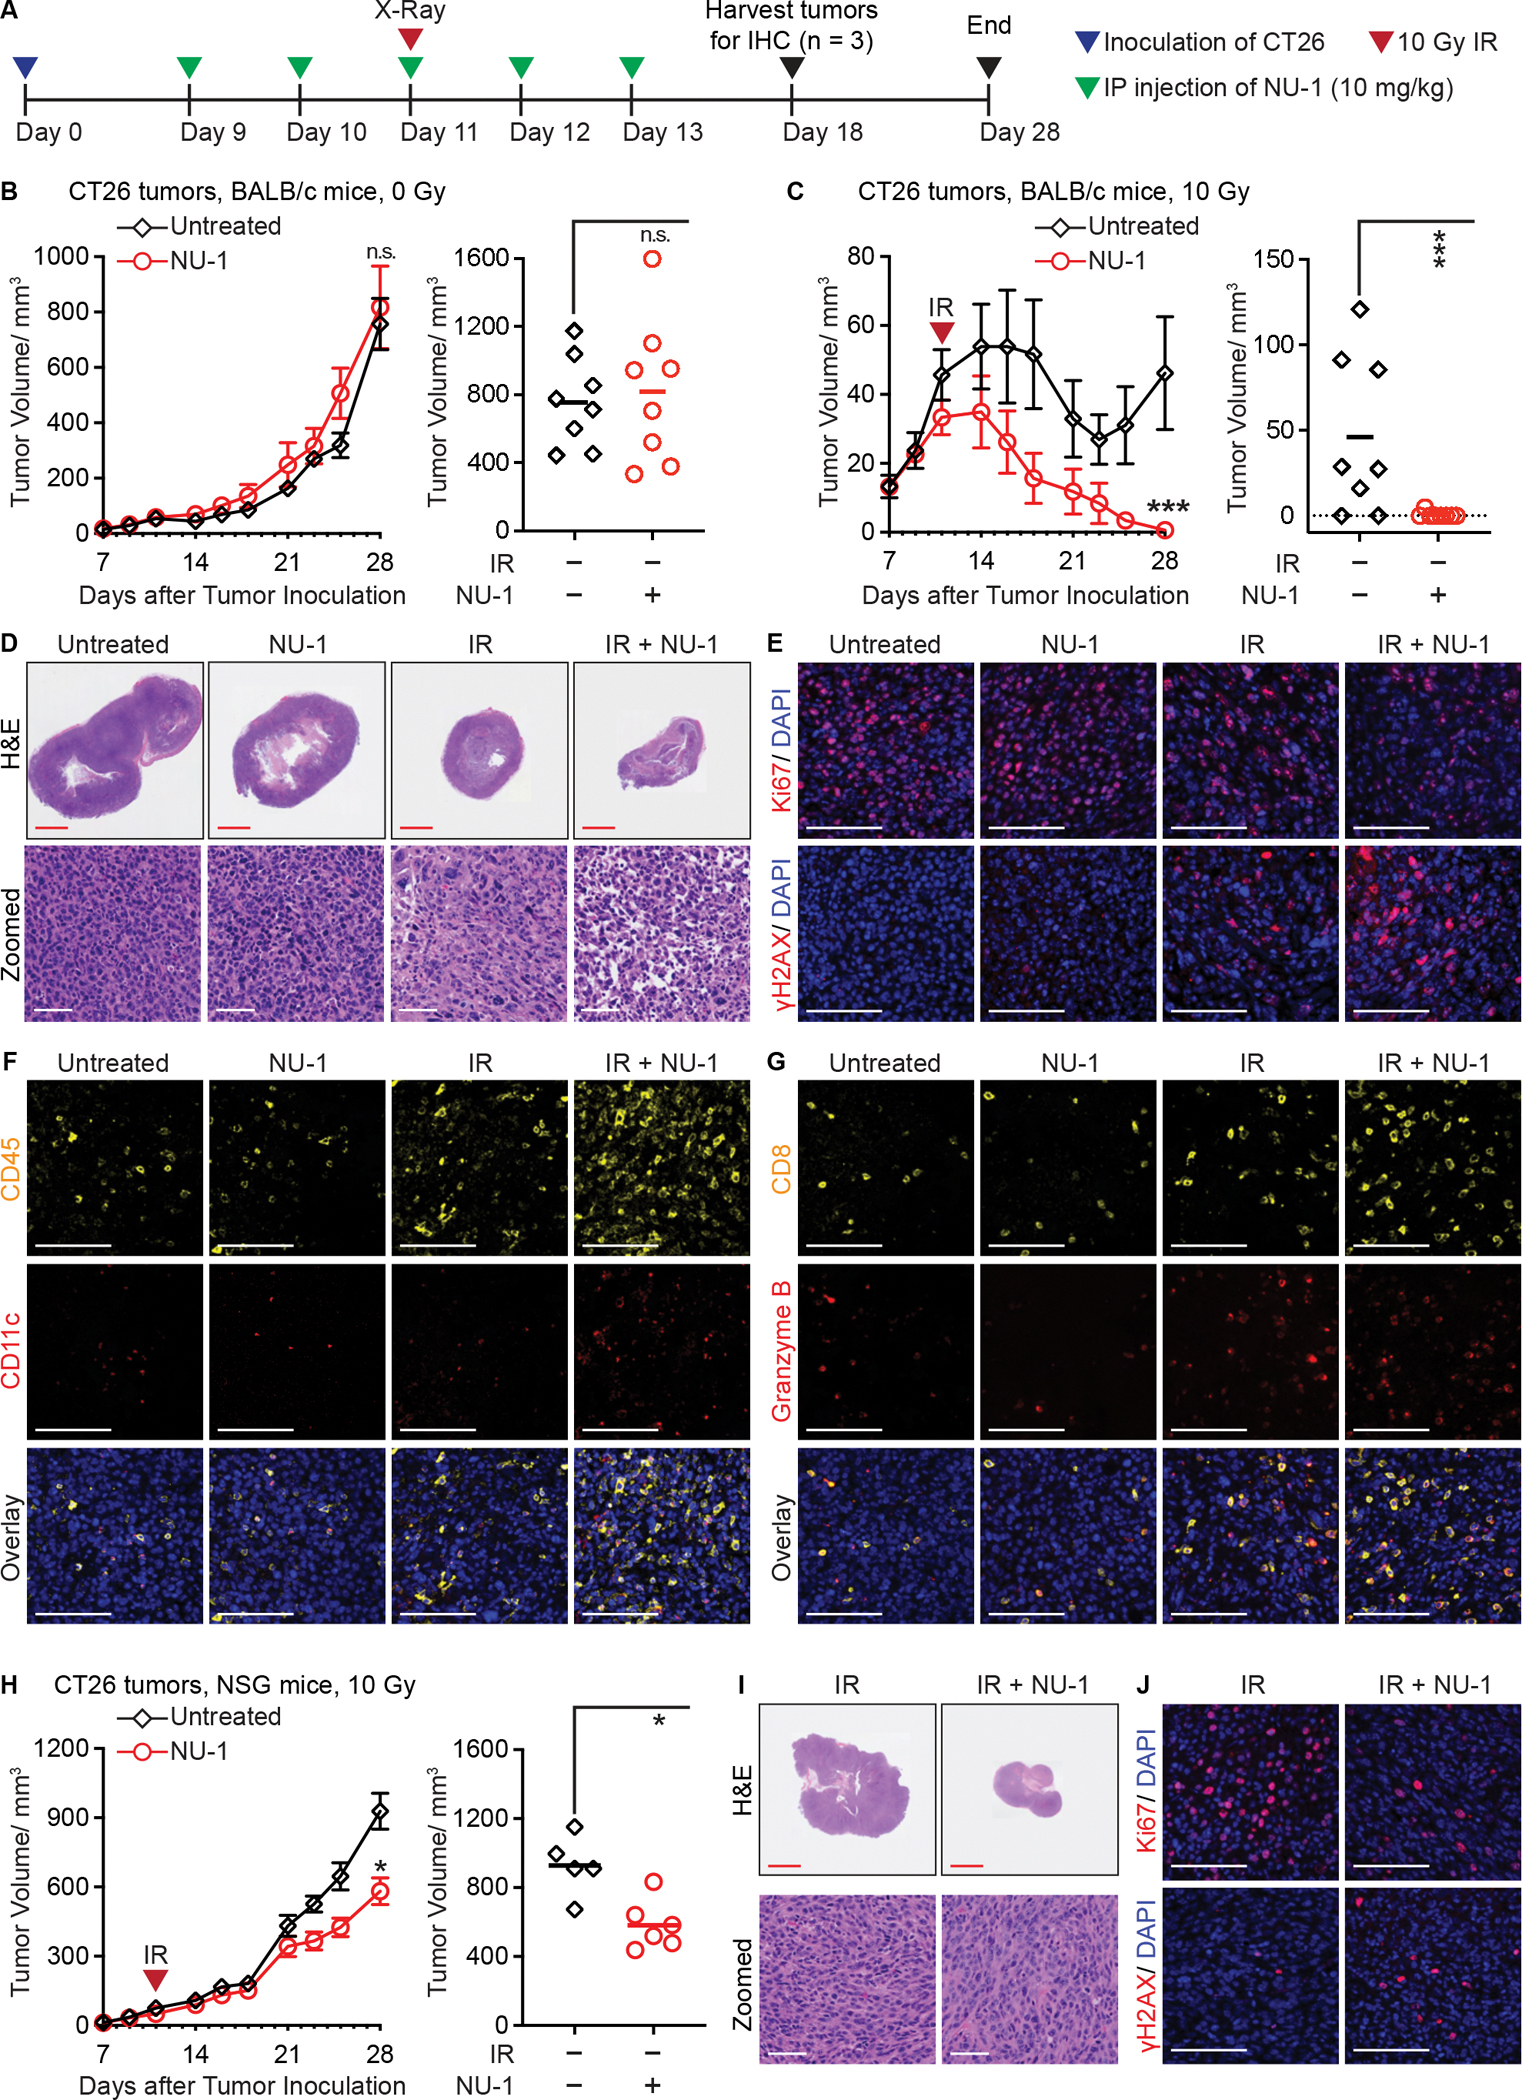
Figure 6. NU-1 confers immunogenic radiation sensitization that leads to tumor elimination.

(A) Experimental schema for treating mice bearing CT26 subcutaneous tumors.
(B and C) Tumor growth in BALB/c mice treated with NU-1 alone (B) or in combination with 10 Gy irradiation (IR) (C). Shown are tumor growth kinetics (left, mean ± SEM) and tumor volumes on Day 28 (right, individual volume and mean).
(D) Hematoxylin and eosin (H&E) staining of tumor sections collected on Day 18. Shown are representative whole section scanning (scale bar=2.5 mm) and selected enlarged regions (scale bar=60 μm).
(E-G) Representative pseudo-colored images of staining for Ki67 (red) or γH2AX (red) (E), or CD45 (yellow) and CD11c (red) (F), or CD8 (yellow) and Granzyme B (red) (G), overlaid with DAPI (blue). Serial sections with D were used. Scale bars=20 μm.
(H) Tumor growth in NSG mice treated with IR ± NU-1. Shown are tumor growth kinetics (left, mean ± SEM) and tumor volumes on Day 28 (right, individual volume and mean).
(I) Representative H&E staining examples of tumor sections collected from NSG mice on Day 18. Scale bar=2.5 mm (upper) or 60 μm (lower).
(J) Representative images of staining for Ki67 (red) or γH2AX (red), overlaid with DAPI (blue). Scale bars=20 μm.
*** P < 0.001, * P < 0.05, n.s. P > 0.05 (unpaired t-test).
See also Figure S6.
