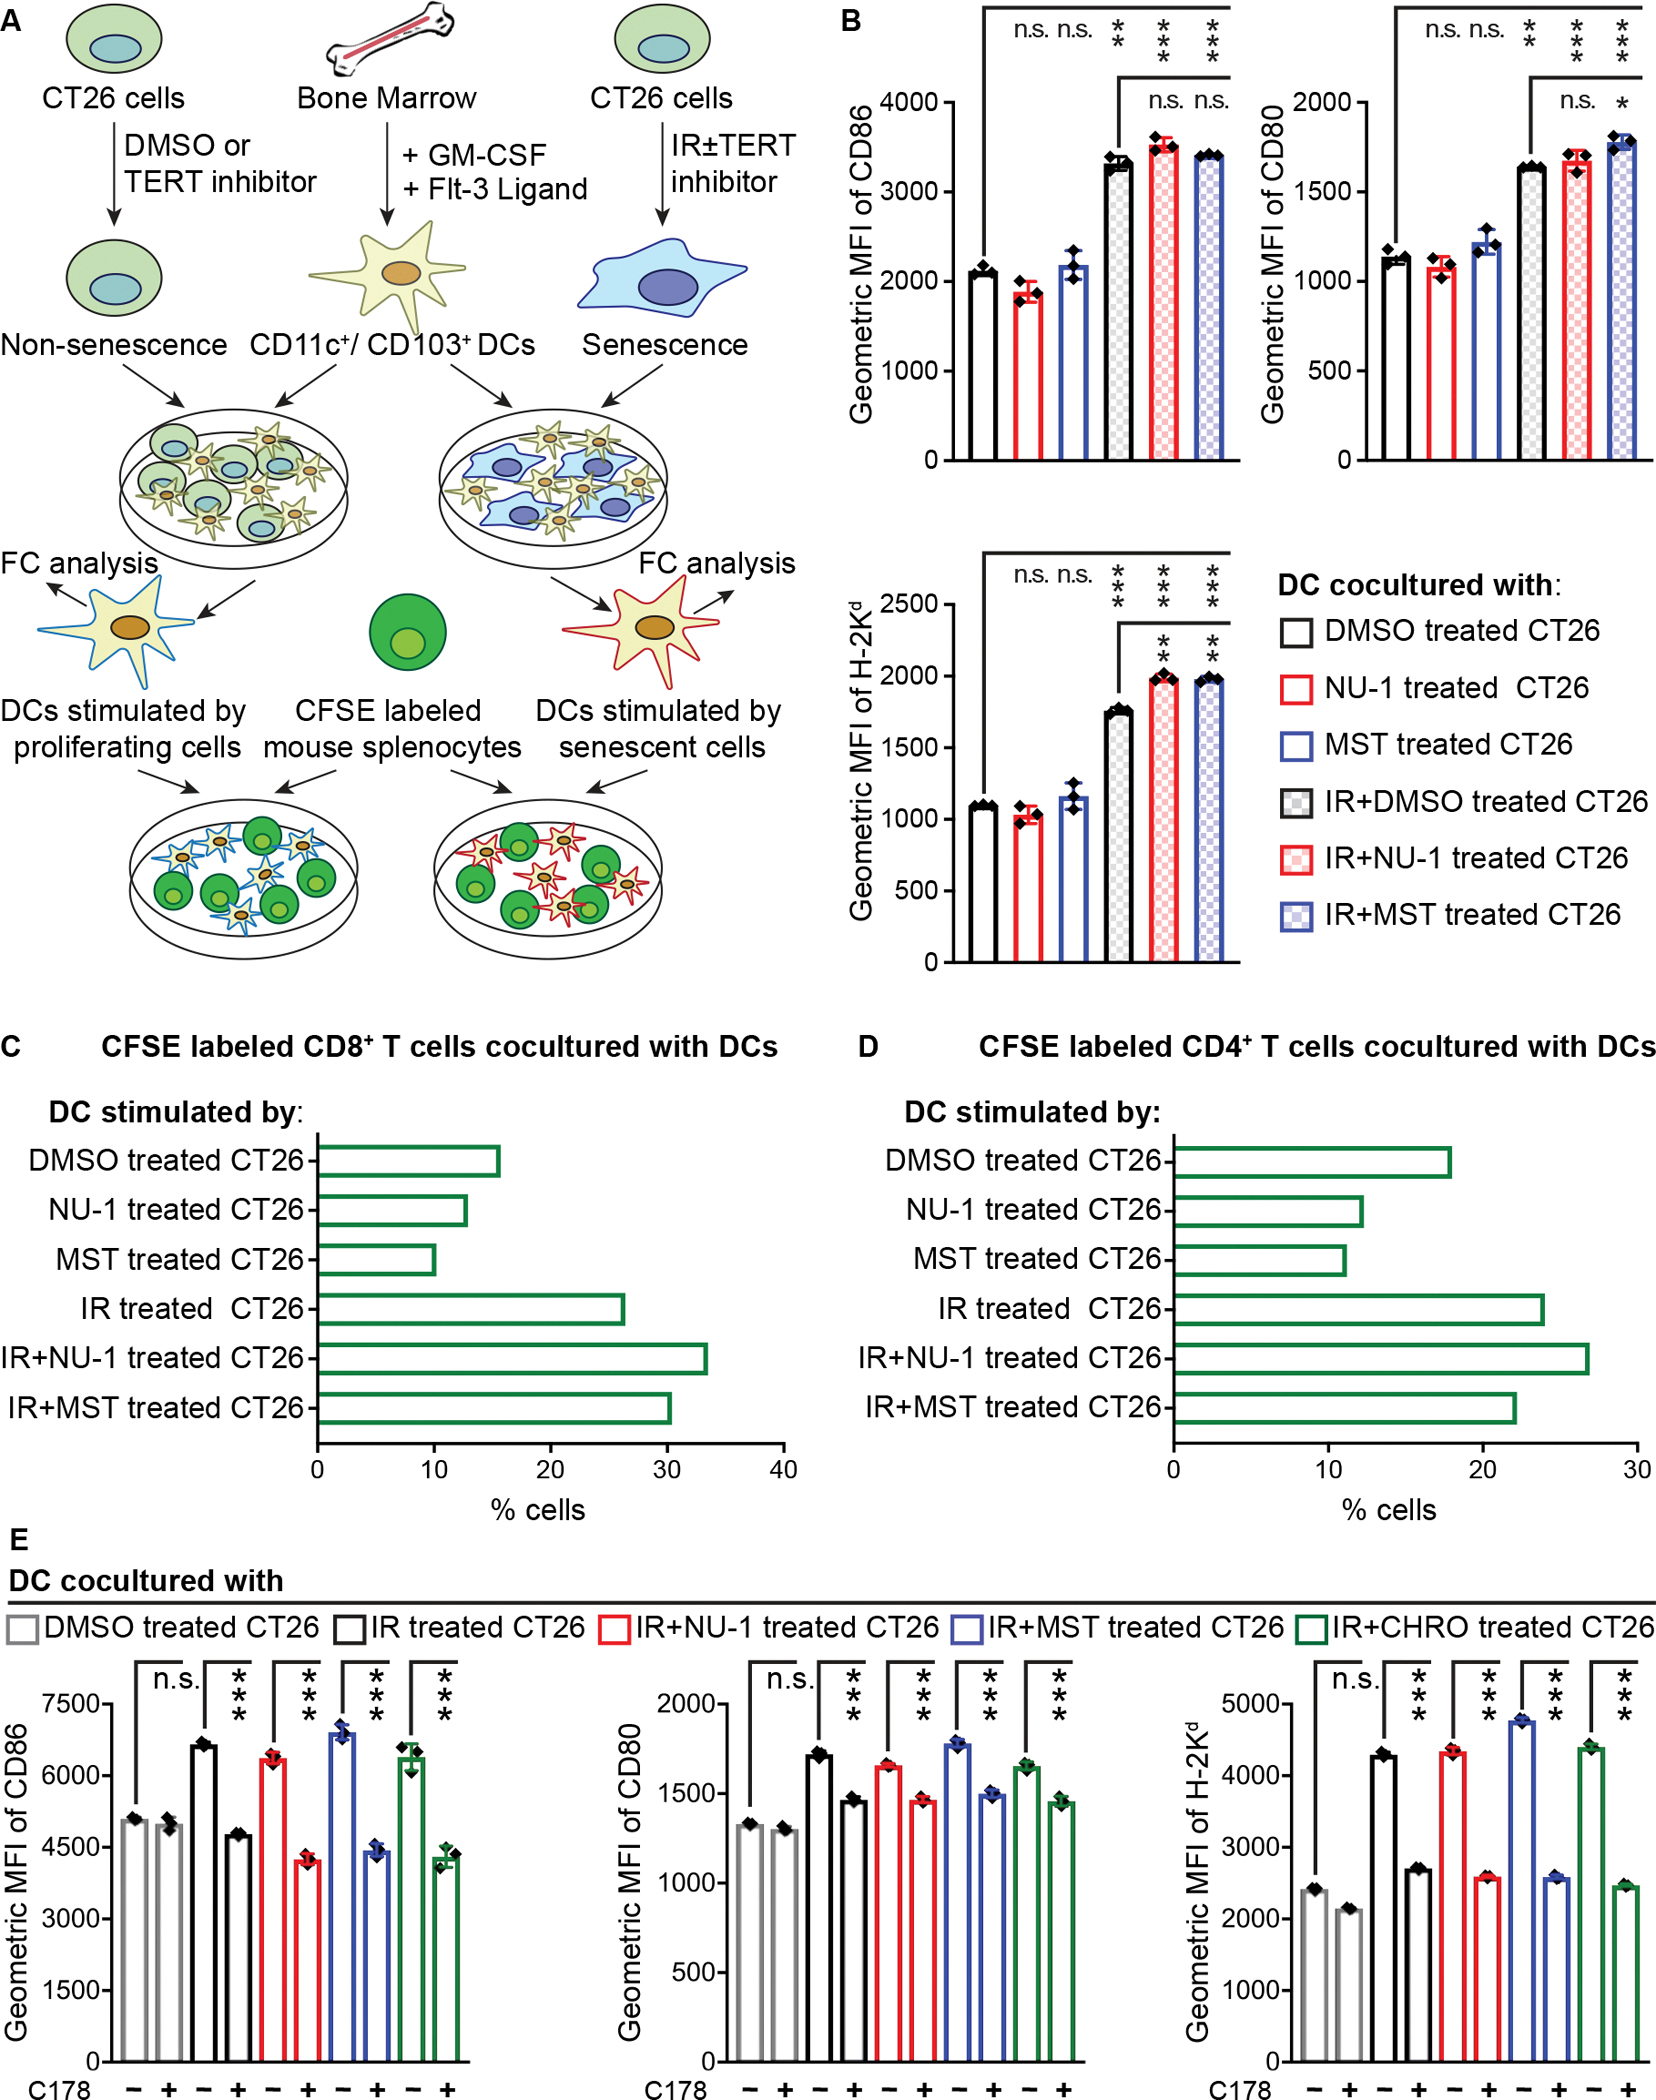
Figure 7. TERT inhibition and irradiation induces immunogenic senescent CT26 cells capable of stimulating DC function via STING signaling.

(A) Experimental schema for forming and stimulating BMDCs with CT26 cells and assaying APC function.
(B) Quantitative analysis of DC activation/maturation. CT26 cells treated with DMSO, NU-1, or MST-312 ± IR, incubated 5 days in culture, and combined with BMDCs overnight. Data obtained from live CD11c+/CD103+ DC population in triplicates, mean ± SD.
(C and D) Proliferative rate of live CD8+/CD4− (C) and CD8−/CD4+ (D) T cell population. CFSE labeled murine splenocytes were cocultured for 5 days with DCs pre-stimulated by CT26 cells treated with DMSO, NU-1, or MST ± IR.
(E) CT26 cells treated with indicated compounds ± 10 Gy IR and cocultured with BMDCs as in B. Data from three experiments, mean ± SD. MFI, mean fluorescence intensity.
*** P < 0.001, ** 0.001 < P < 0.01, n.s. P > 0.05 (unpaired t-test).
See also Figures S7.
