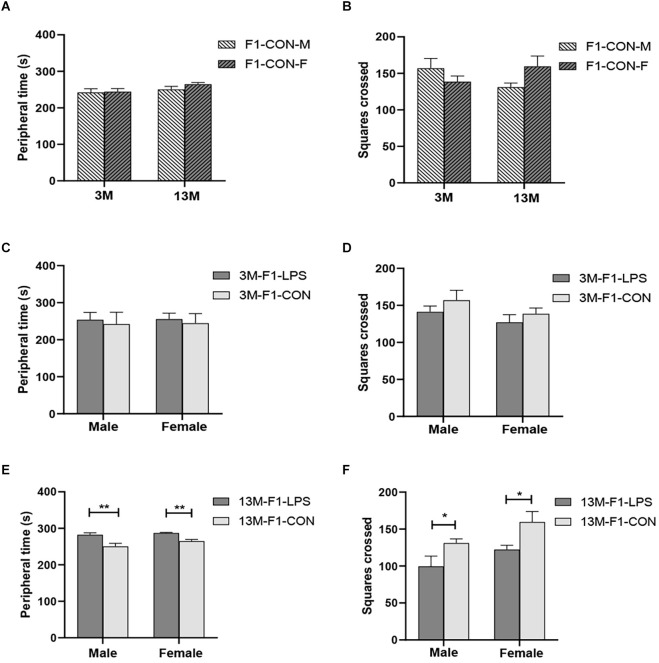
Figure 2.
The results of the open field test in the F1 generation. (A,B) Peripheral time and the number of squares crossed at different ages in control groups. n = 10 male or female mice/group. Error bars = standard error of the mean (SEM); *P < 0.05, **P < 0.01 compared with the 3-month-old group. (C,E) Peripheral time and (D,F) number of squares crossed for 3- (3 M) and 13-month-old (13 M) CD-1 mice in the different treatment groups. n = 10 male or female mice/group. Error bars = SEM. *P < 0.05, **P < 0.01. CON-M, male mice exposed to saline in utero; CON-F, female mice exposed to saline in utero; F1-CON, F1 mice exposed to saline in utero; F1-LPS, F1 mice exposed to prenatal inflammation.

