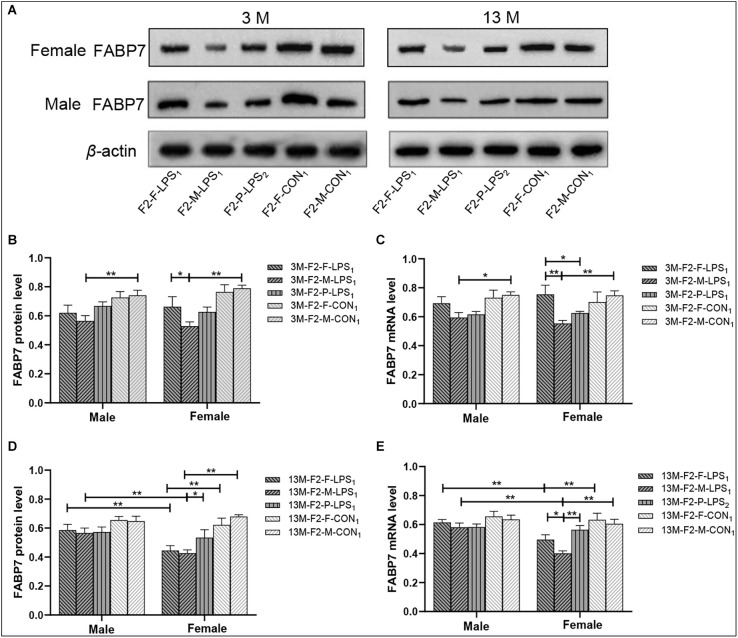
Figure 7.
FABP7 protein and mRNA expression levels in F2 generation mice. (A) Representative FABP7 immunoreactive bands in the hippocampi of F2 mice in the different groups at different ages. (B,D) Hippocampal FABP7 protein levels in 3-month-old (3 M) and 13-month-old (13 M) mice in different groups. (C,E) Hippocampal FABP7 mRNA levels in the 3-month-old (3 M) and 13-month-old (13 M) mice in different groups; n = 6 male or female mice/group. Error bars = standard error of the mean (SEM). *P < 0.05, **P < 0.01. F2-M-LPS1, mice whose mothers were exposed to prenatal inflammation; F2-P-LPS2, mice whose parents were exposed to prenatal inflammation; F2-F-LPS1, mice whose fathers were exposed to prenatal inflammation; F2-M-CON1, mice whose mothers were exposed to saline in utero; F2-F-CON1, mice whose fathers were exposed to saline in utero.

