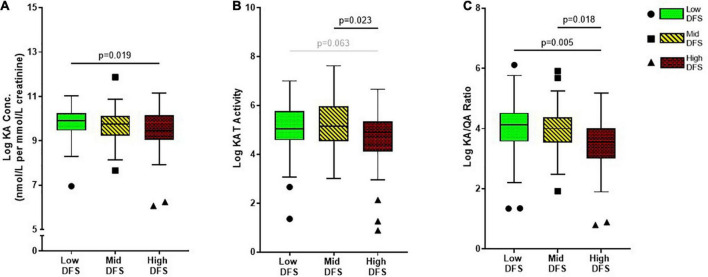
FIGURE 2.
Boxplots showing the difference in (A) Kynurenic acid (KA), (B) Kynurenine aminotransferase (KAT) activity, and (C) KA/QA ratio across the low, mid, and high DFS groups. The low DFS participants are represented by green box-and-whisker and circle symbols, the mid DFS participants are represented by yellow box-and-whisker and square symbols, and the high DFS participants are represented by red box-and-whisker and triangle symbols. The symbols indicated participants that had > 2 standard deviations within the group. The median and interquartile range are displayed for each group.

