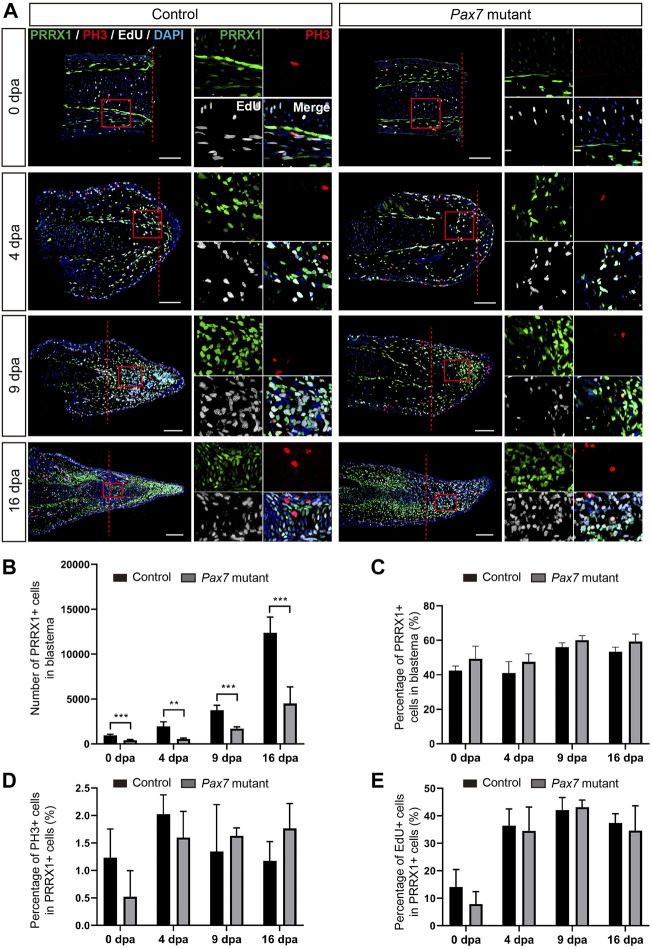
FIGURE 3.
Fibroblast dynamics during limb regeneration in the absence of muscles. (A) Immunofluorescence images of PRRX1 (green), PH3 (red), combined with EdU (white) and DAPI (blue) staining in limb longitudinal-sections, at 0, 4, 9 and 16 dpa, from control and Pax7 mutant animals. Boxed regions are shown at higher magnification as separated channels. Red dashed lines, amputation planes. Scale bars, 200 μm. (B) and (C) Quantification of the absolute number (B) and the percentage (C) of PRRX1 positive cells, in the areas of the newly formed blastema combined 500 μm zone proximal to the amputation plane, at 0, 4, 9 and 16 dpa, from controls (n = 4) and Pax7 mutants (n = 4). Data are presented as mean ± sem, **p < 0.01, ***p < 0.001. (D,E) Quantification of the percentage of PH3- (D) and EdU- (E) positive cells, in PRRX1-positive cells quantified in (B).

