FIGURE 4.
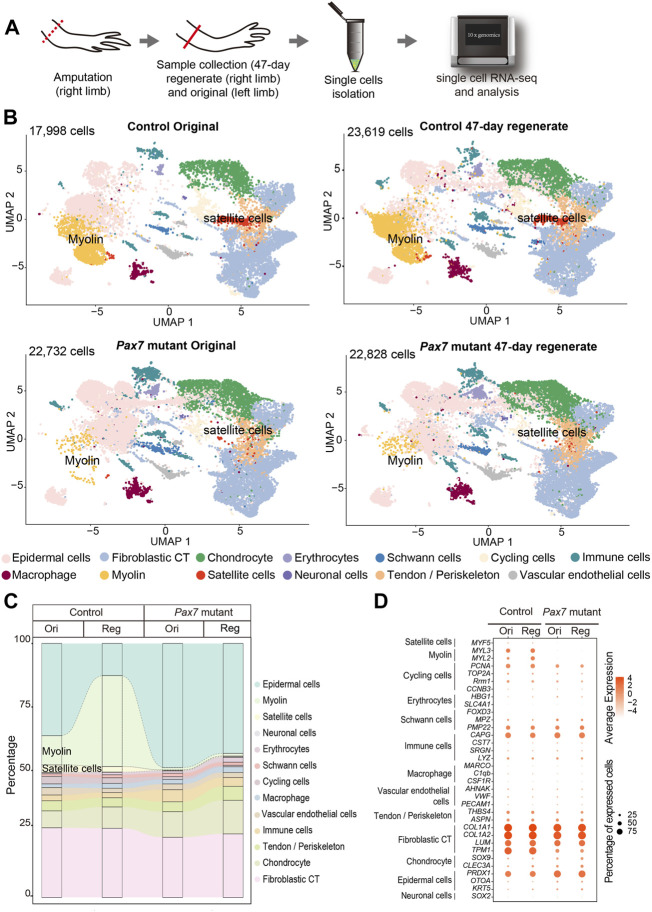
Integrated transcriptional cell state atlas of the axolotl limb from the 47-day regenerate and original in both controls and Pax7 mutants. (A) Scheme of the scRNA-seq workflow used for the limb tissues collected from the 47-day regenerate (right limb) and original (left limb) in both controls and Pax7 mutants. Dotted line, amputation plane; line, the position of sample collection. (B) UMAP visualization of the scRNA-seq data from four sampling stages. The cell-type annotation is determined by published cell-lineage specific markers. Two muscle-related cell types are highlighted. (C) Sankey plot showing the percentage of all 13 cell types from the 47-day regenerate and original limbs in both controls and Pax7 mutants. (D) Dot plot visualizing the expression of marker genes of all 13 cell types shared between the controls and Pax7 mutants. The circle size represents the percentage of cells at each sample expressing the gene, and color represents the average expression level.

