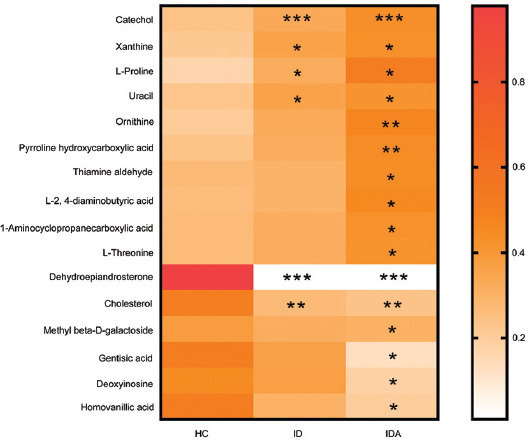
FIGURE 8.

The shift of fecal metabolites in HC, ID and IDA of pregnant women according to the metabolic profiling, only variables showing significant changes in IDA/ID related to controls were used to generate the heat map. *p < 0.05, **p < 0.01, ***p < 0.001 versus HC. IDA: iron deficiency anemia; ID: iron deficiency; HC: healthy control.
