FIGURE 8.

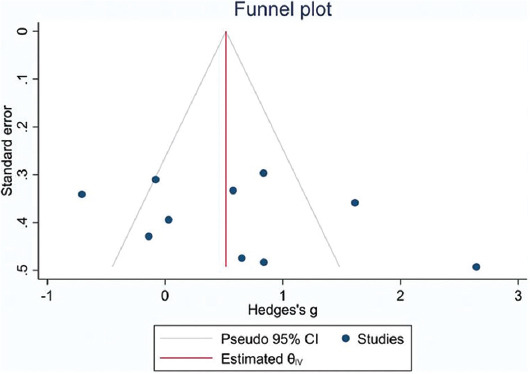
Forest plot and funnel plots for CAL gain adjusted with Trim and Fill method. Circles indicate included studies (Stata Software). CAL: Clinical attachment loss

Forest plot and funnel plots for CAL gain adjusted with Trim and Fill method. Circles indicate included studies (Stata Software). CAL: Clinical attachment loss