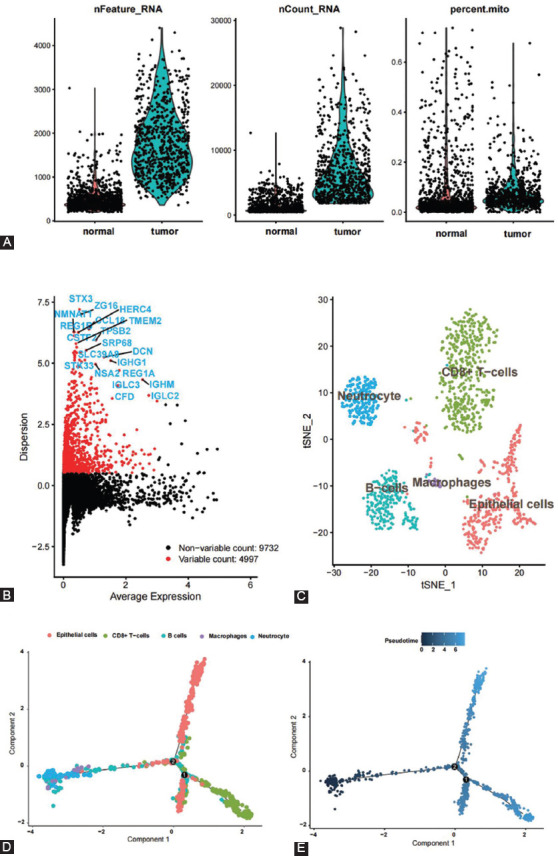
FIGURE 1.

scRNA-seq clustering and pseudotime analysis in the GSE163974 dataset. (A) The sample quality control and proportion of mitochondria; (B) the highly variable genes are presented and the top 25 genes of each dataset are visualized; (C) UMAP map showing the scRNA cell clusters and annotation in each dataset; and (D and E) pseudotime analysis of the GSE163974 dataset.
