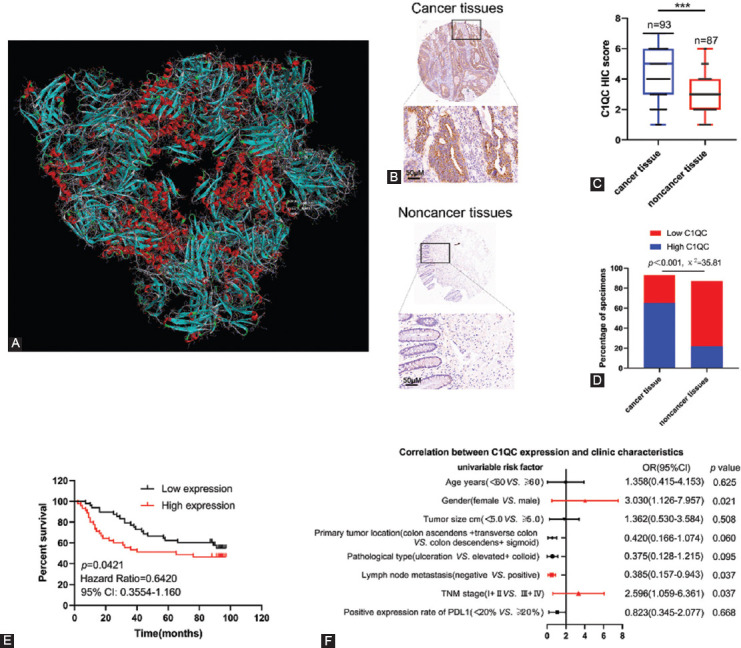
FIGURE 5.

Expression levels of C1QC in colon cancer tissue and non-cancer tissue and its relationship with clinical characteristics. (A) Palivizumab docking with C1QC; the three-dimensional diagram shows the binding conformation of palivizumab (red) with C1QC (azure); (B) representative immunohistochemistry staining of C1QC expression in colon cancer tissue and non-cancer tissue; (C and D) statistical analysis of immunohistochemical scores of C1QC, and percentage of high expression and low expression of C1QC in colon cancer tissue and non-cancer tissue; (E) Kaplan-Meier survival analysis of C1QC expression in patients with colon cancer; and (F) correlations of C1QC expression levels in colon cancer tissue and clinicopathological features of colon cancer patients. The statistical significance was determined by the χ2-test. Data are expressed as the mean ± SD.
