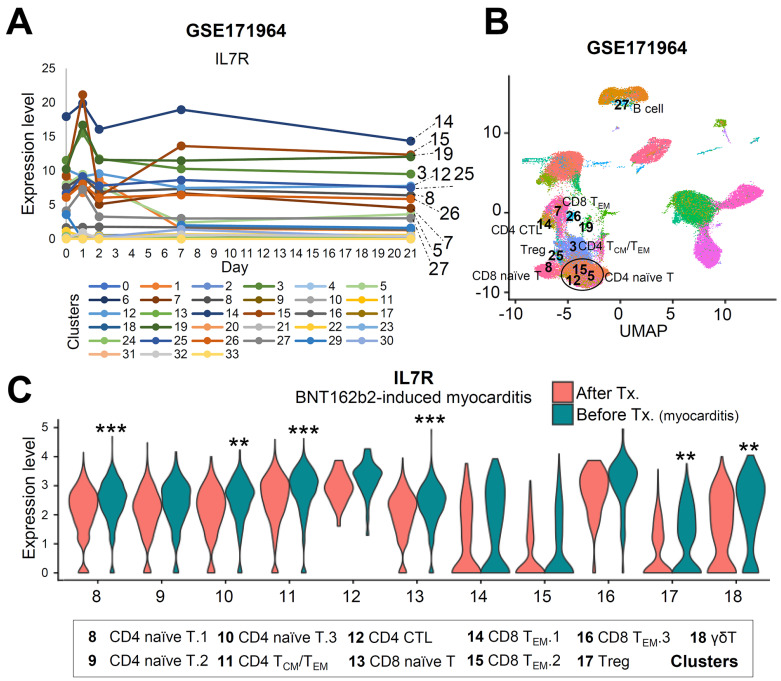
Fig. 6. The mRNA expression level of IL7R is increased at the time of acute myocarditis.
(A) T Single-cell RNA sequencing data of PBMCs of vaccinated individuals was analyzed with automatic clustering. The expression level of IL7R of each cluster is shown with different colors denoting different clusters. (B) Cluster information marked in 6A are shown on the UMAP representation. (C) The expression level of IL7R in BNT162b2-induced myocarditis case is shown in T cell clusters. **P < 0.01, ***P < 0.001; Wilcox test.

