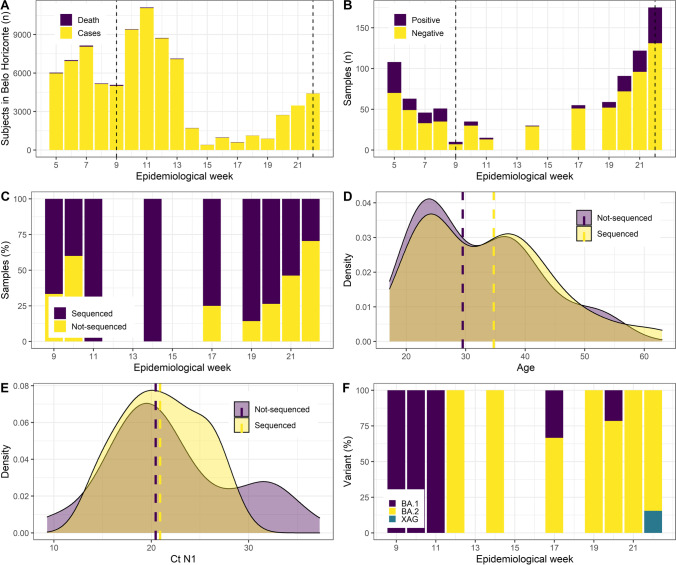
Fig. 1.
Epidemiological and genomic surveillance results. A Distribution of the number of cases and deaths in the city of Belo Horizonte, capital of Minas Gerais state. Dashed lines indicate the period of sampling for sequencing. B Distribution of the number of tests conducted in the MonitoraCOVID project between the 5th and 22nd epidemiological week and their results. Dashed lines indicate the period of sampling for sequencing. C Percentage of the positive samples that were successfully sequenced between the 9th and 22nd epidemiological weeks. D Age distribution between sequenced (median 34.7) and not-sequenced samples (median 29.5). Dashed lines indicate the median age in each group. E N1 target cycle threshold (Ct) distribution between sequenced (median 20.9) and not-sequenced (median 20.4) samples. Dashed lines indicate the median Ct in each group. F Distribution of the BA.1, BA.2, and XAG variants found in the study period

