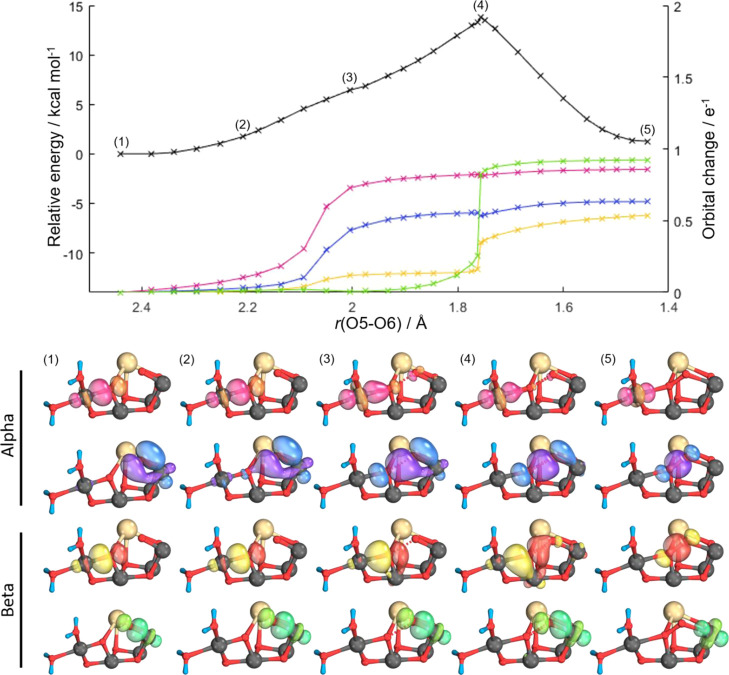
Figure 4.
Intrinsic bond orbital (IBO) analysis of the Ms = 3 state of the oxo–oxo form. Top, potential energy surface (PES) for O5–O6 bond formation (black) accompanying IBO changes color-coded by the orbitals shown beneath. Representative IBOs are given at the points labeled on the PES above showing α and β spin evolution; see text for details.

