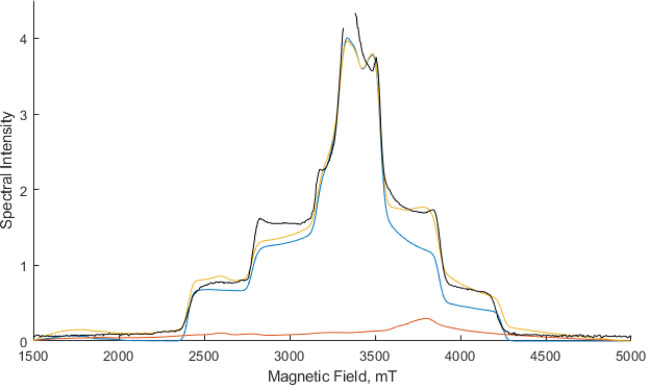
Figure 7.
Comparison of 94 GHz EPR spectral simulations of S = 6 (red), S = 3(blue), and a 0.7:0.3 mixture of S = 6:S = 3 (yellow). The experimental spectrum from Chrysina et al.13 is shown in black. Simulation parameters used are S = 6, g = 2, D = 1.523 cm–1, E/D = 0.14 and S = 3, g = 2, D = 0.179 cm–1, E/D = 0.28.

